The first project
Getting started
Startup
Arrigo View Designer allows you to add arguments and elements to your Arrigo windows. It can be something like photos, buttons, values, bar charts, etc. The home page can consist of widgets containing an overview of how the installation is running.
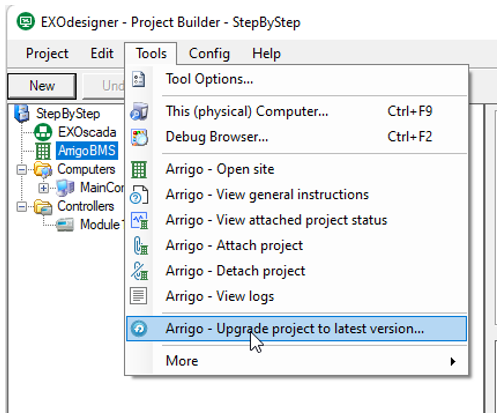
Before we start we need to update the project to the latest version, see print screens below.
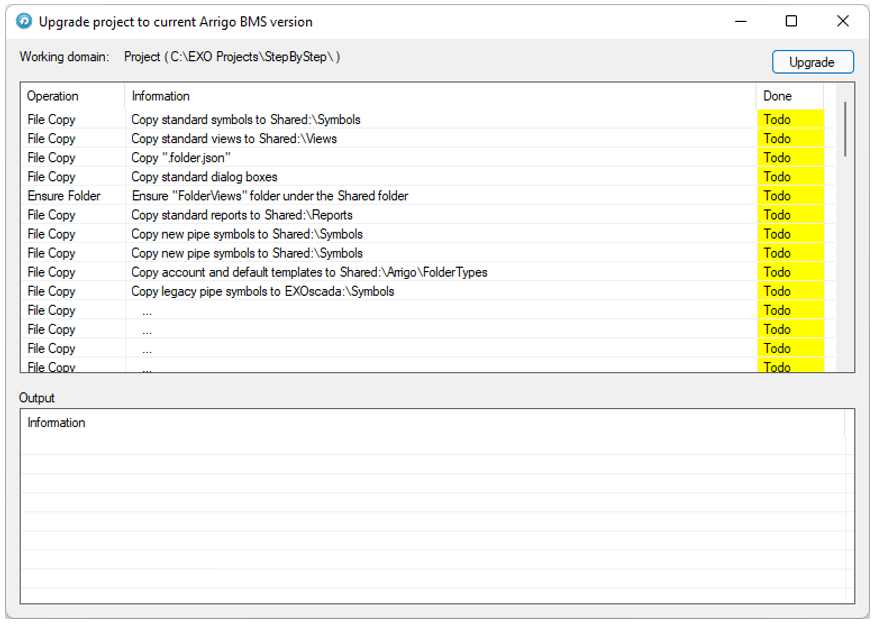
Open the StepByStep EXOcompact project and click on ArrigoBMS. Go to pulldown menu Tools and choose Upgrade project.
Click Upgrade at the top right to run it.
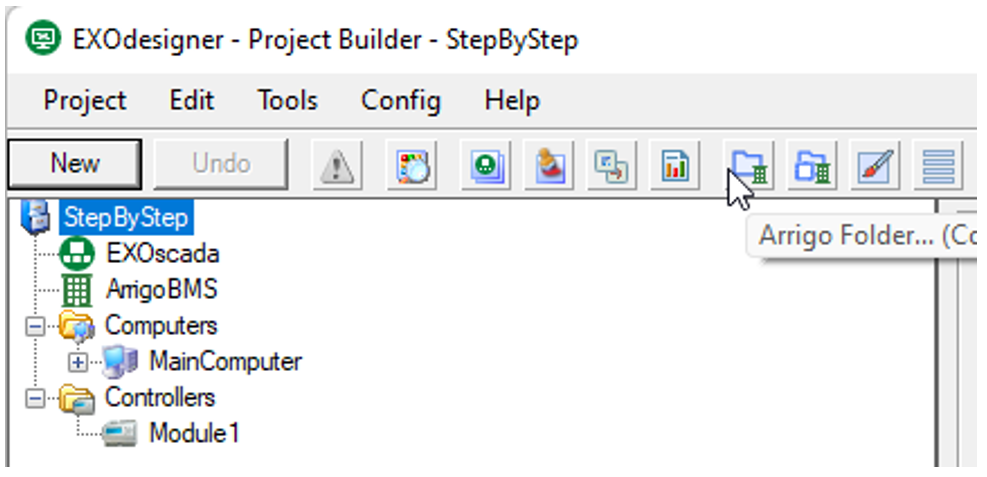
Select Module1 of the project and among others the following buttons are shown at the top of the tool.
Here you choose which window is opened when clicking this control in the tree structure in the explorer.
So if you have copy controls you can point to a shared folder to open the same window. Via arguments you give the necessary unique items, for example the “Name” (name of the controller).
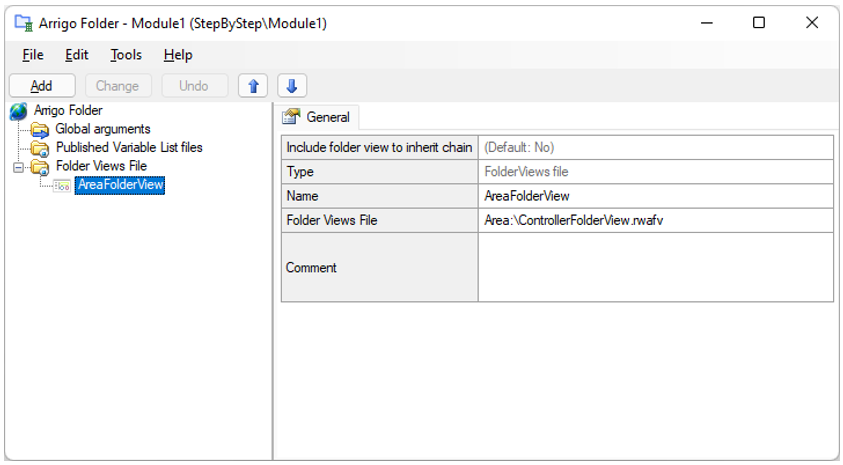
The second button is the Folder view files and it contains the dashboard (first overview page of the area or controller) with the widgets and link icons.
Also open from the first window and then right mouse click on the text “Folder Views File” or via pulldown at the file name.
![]()
The first button is the View Designer in which we create the graphic image.
The second button is the List View designer for creating lists or tables that are useful for display on the phone.
Create a widget (rwlv)
Select Module1 from the StepByStep project and load a controller with that software.
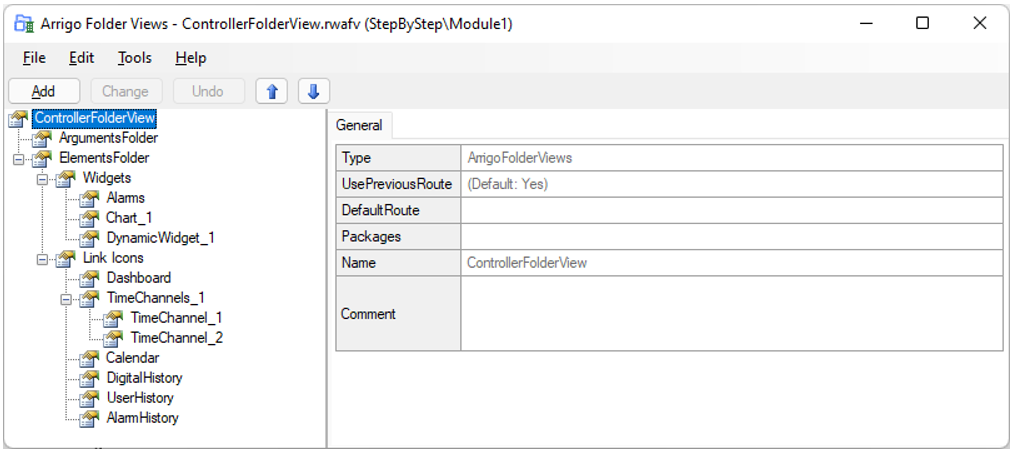
- Choose “Arrigo Folder View”:
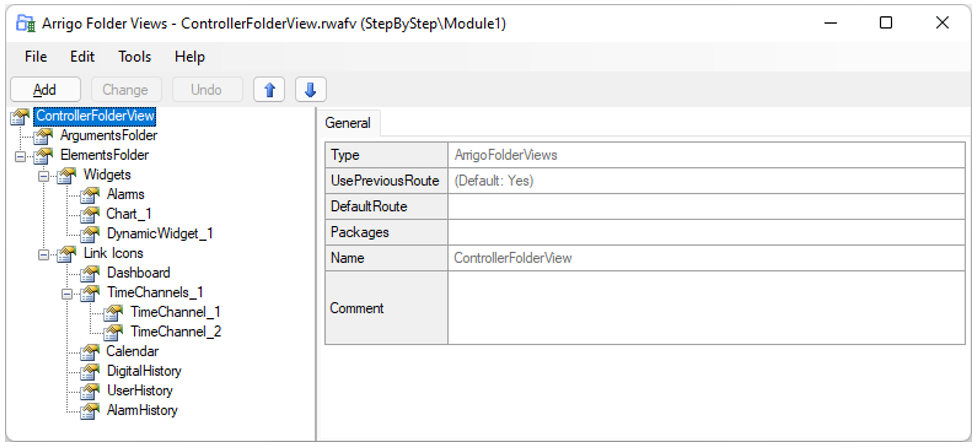
- Choose “Add”
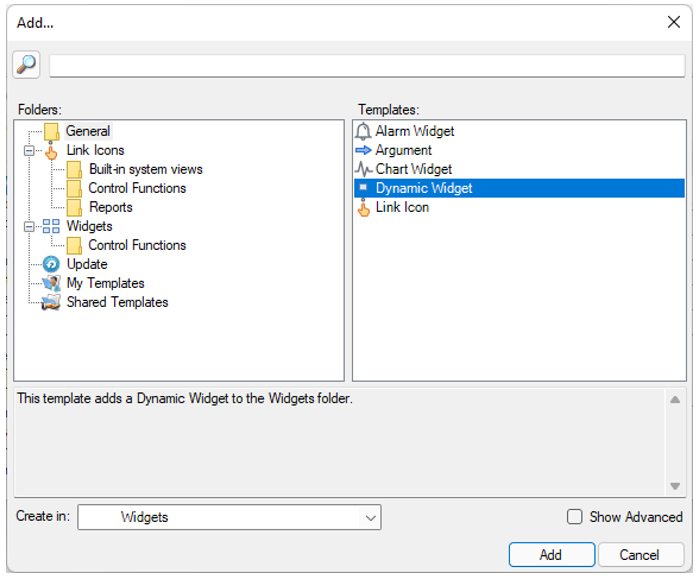
- Select under “General” right, left “Dynamic Widget” and press “Add” at the bottom
The Widget is added.
-
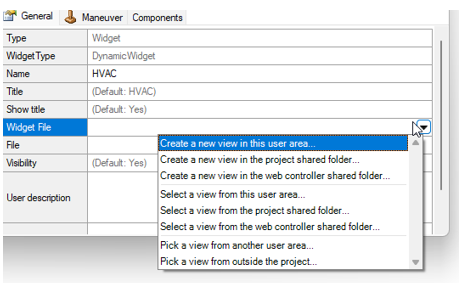
Adjust the Wigget's “Name” to “HVAC”
-
Choose “File and “Save” to save your changes
-
In the field “Widget File” on the right when expanding the arrow, choose “create a new view in this user area” and choose “OK”
-
Right click on the text “Widget file” and the “List View” tool will open.
-
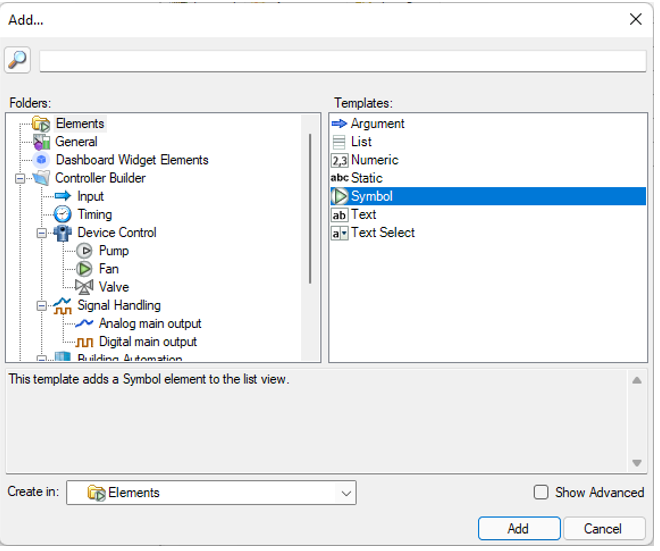
Select “SymbolElements”
-
Press “Add” at the top right and choose “Symbol” under Elements
-
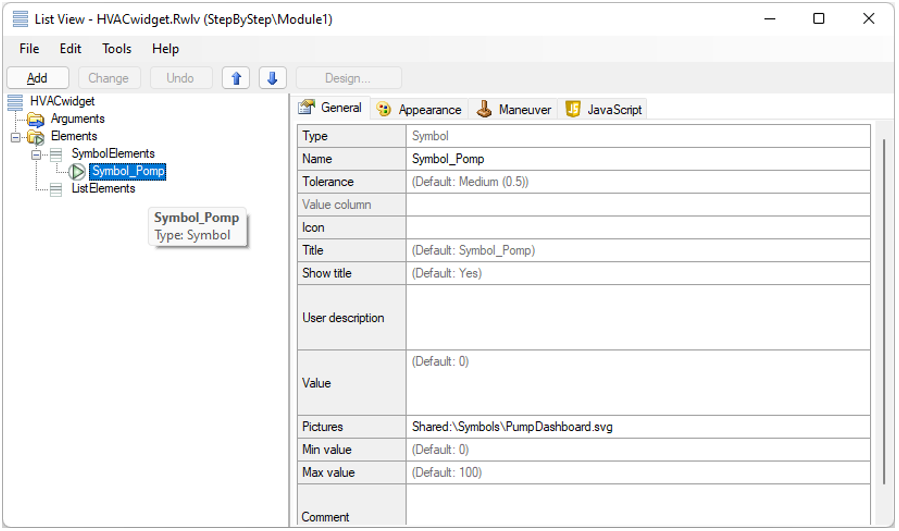
Change the “Name” to “Symbol_Pump”
-
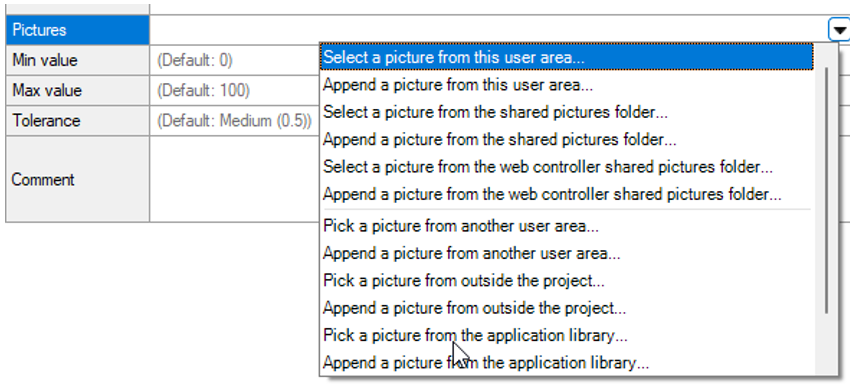
In the “Pictures” field, select the arrow on the right “Select a picture from the shared picture folder”
-
Select “PumpDashboard”
-
Press “Add”
-
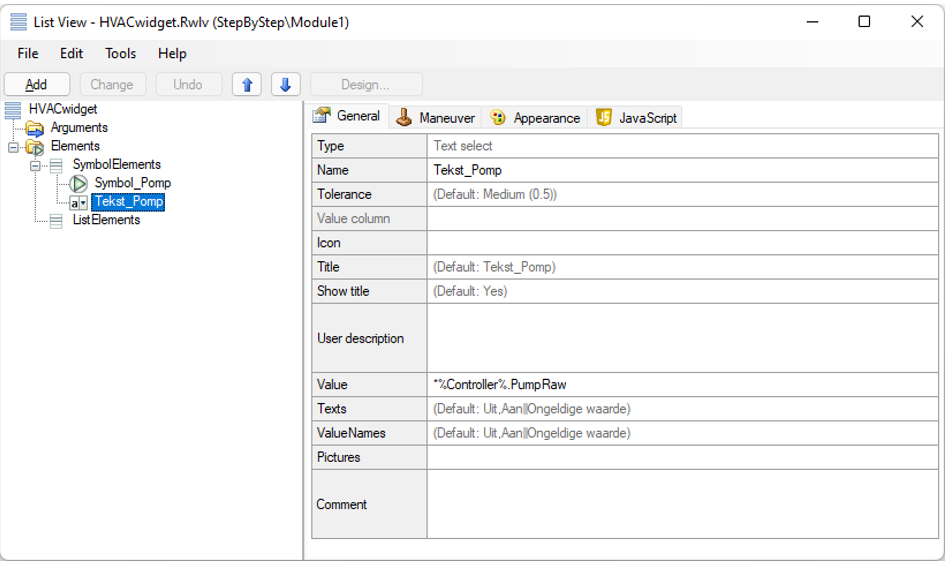
Under “Elements” choose “Text Select” and press “Add”
-
Change the “Name” to “Text_Pump”
-
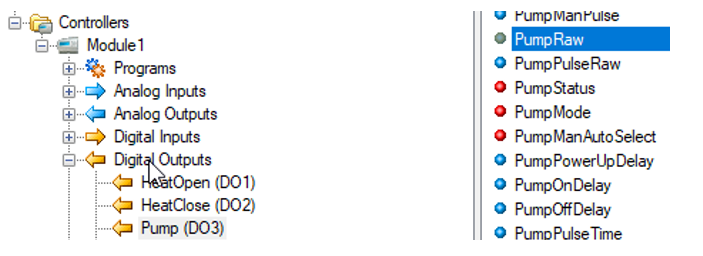
Right-click on the text “Value” to open the EXO Browser.
-
At the bottom right, open Module1 – Digital Outputs and then Pump. Select the variable PumpRaw and press “OK” at the bottom right of the tool
- You can adjust the “Texts” field as desired, off, on is good for pump indication.
-
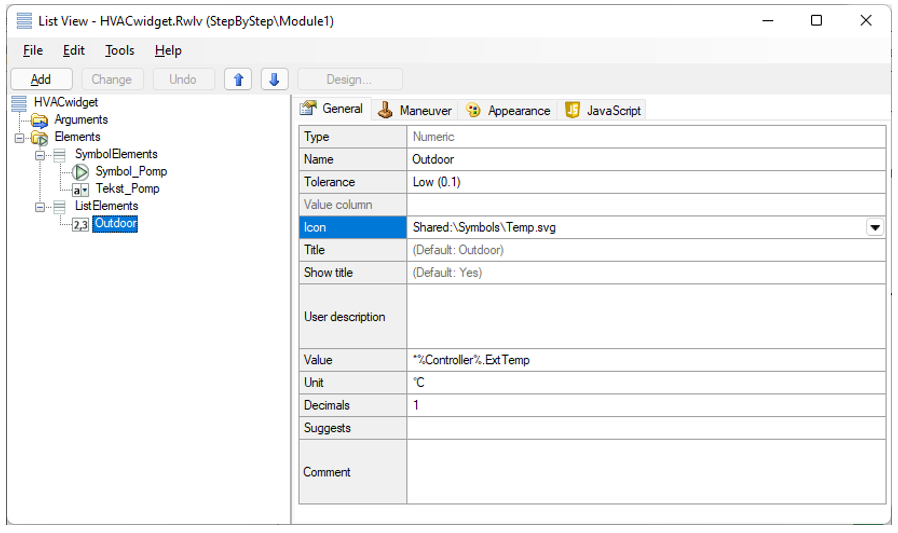
Select ListElements
-
Press “Add” and choose “Numeric”
-
Adjust the “Name” to Outdoor
-
Set the “Tolerance” to “Low (0.1)”
-
At “Icon” choose the “Temp” from the shared Symbol folder
-
Right-click on the text “Value” to open the EXO Browser.
-
At the bottom right, open Module1 – Analog Inputs. Select the variable ExtTemp and press “OK” at the bottom right of the tool
-
Select the °C sign in the “Unit” field
-
And in the field “Decimals” choose the 1
-
Press “Change” at the top
- Choose File and save
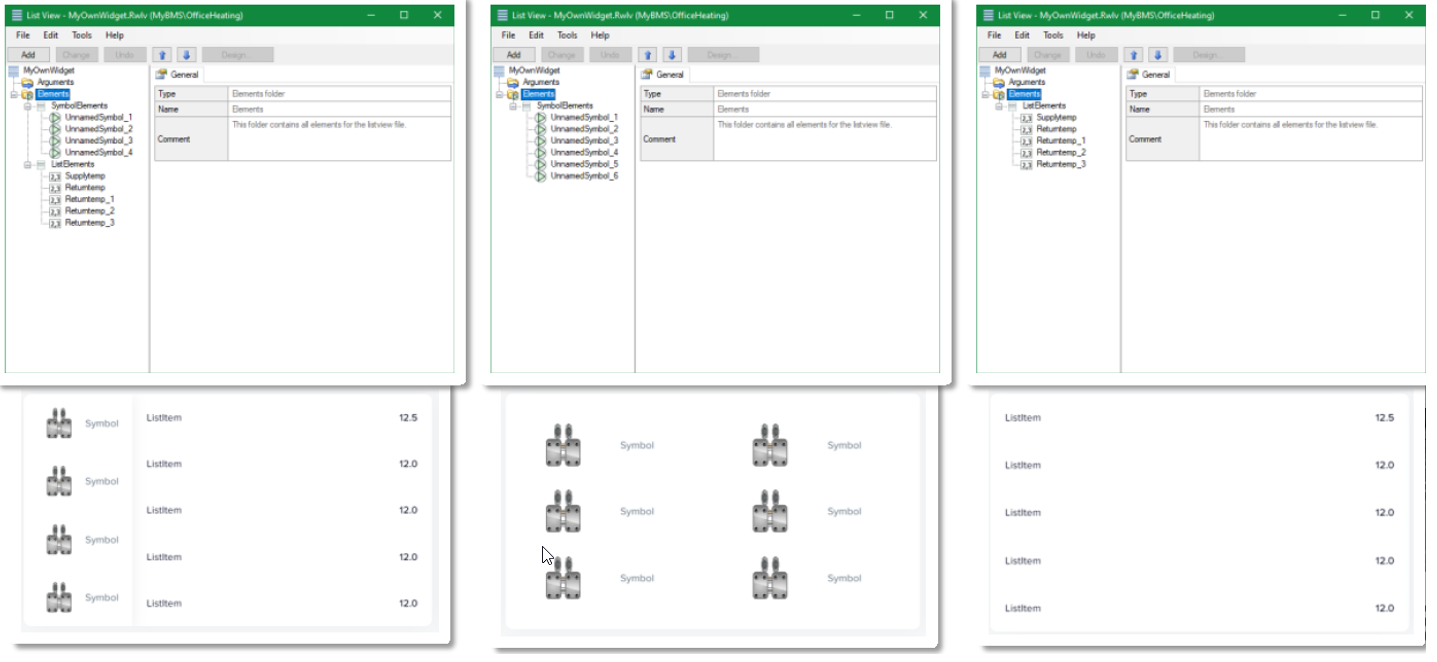
You have the following options regarding views of Widgets with the maximum number of Symbol Elements or List Elements:
Start Arrigo
To test the created Widget we need to start Arrigo with a loaded controller online.
-
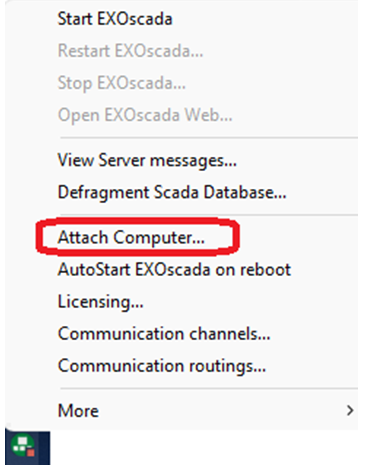
To start Arrigo, right-click on the icon at the bottom right of your PC's time
-
Choose “Attach Computer”
-
In the Attached Computer screen, choose “Select a Project”
-
Select the “StepByStep” project and press “OK”
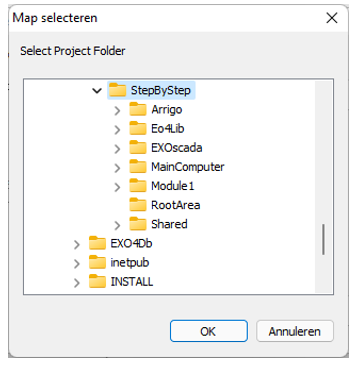
- Press “OK” at MainComputer
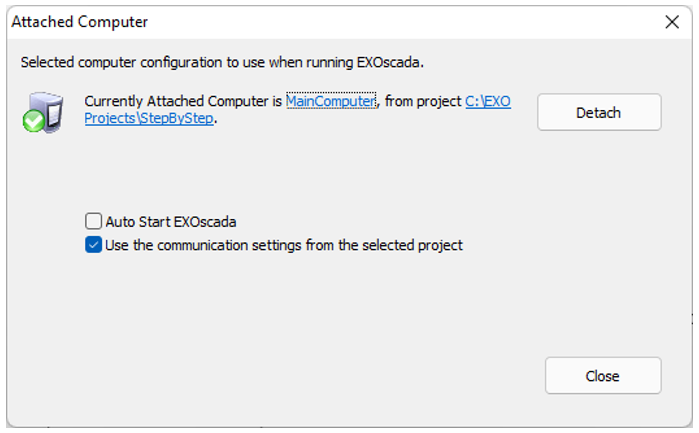
-
And choose close
-
Double click on the EXOscada icon next to the time to start Arrigo. The square in the icon will turn from yellow to green as already described in this document.
-
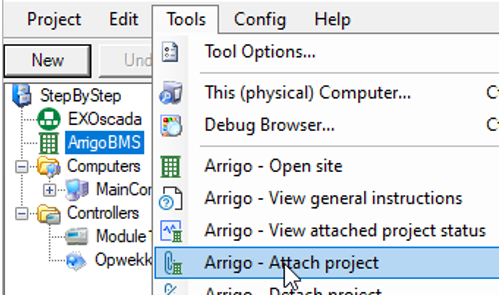
Open EXOdesiger - Project Builder
-
Select “ArrigoBMS”
-
Select at Tools “Arrigo – Attach project”
The tool starts attaching project. Press any key to close the window.
- When the square is green, you can open your browser and enter the URL to:
http://127.0.0.1/arrigo/ or
localhost/arrigo/
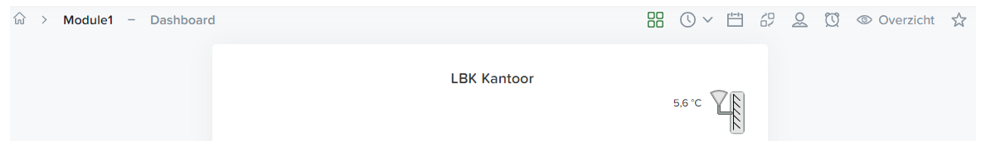
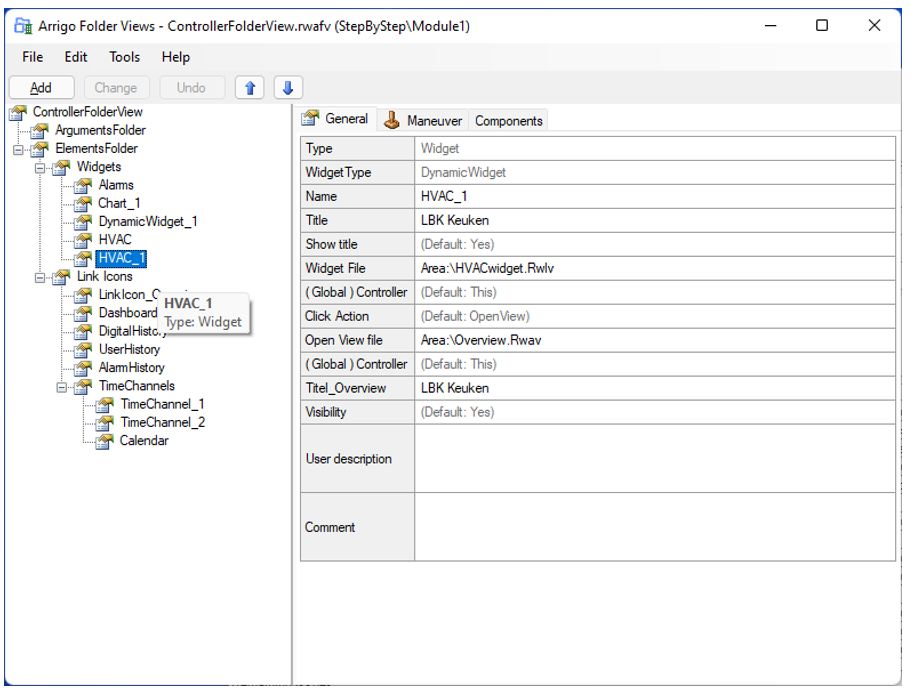
- You log in with, for example, operator operator and after logging in, select Module1. The following screen will then be shown with your created Widget at the bottom right.
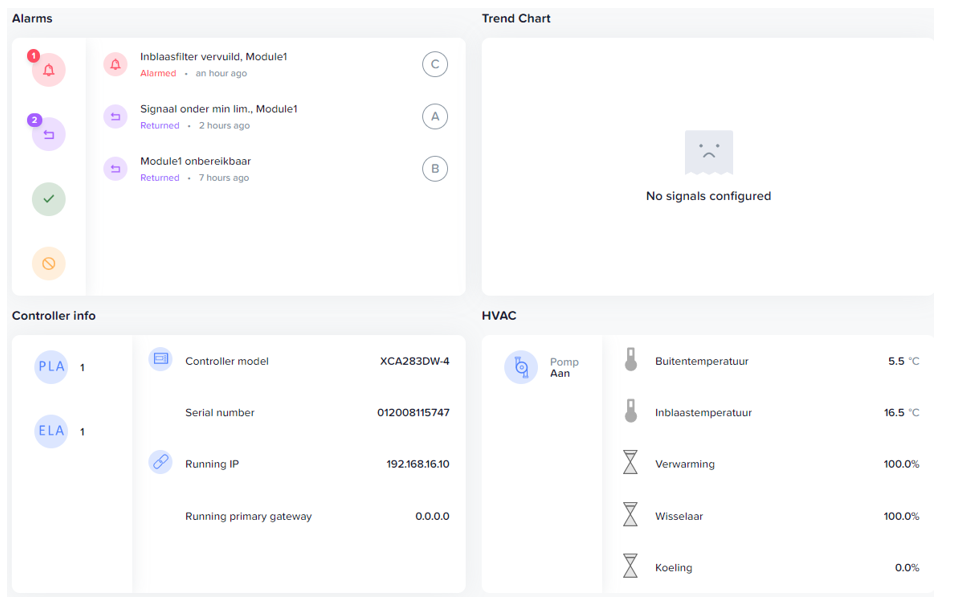
If necessary, add more in the custom widget.
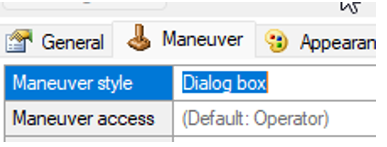
You can also add a value that is adjustable. In the Maneuver tab, select Maneuver stule Dialog box.
Create link to overview (rwav)
Select Module1 from the StepByStep project and load a controller with that software.
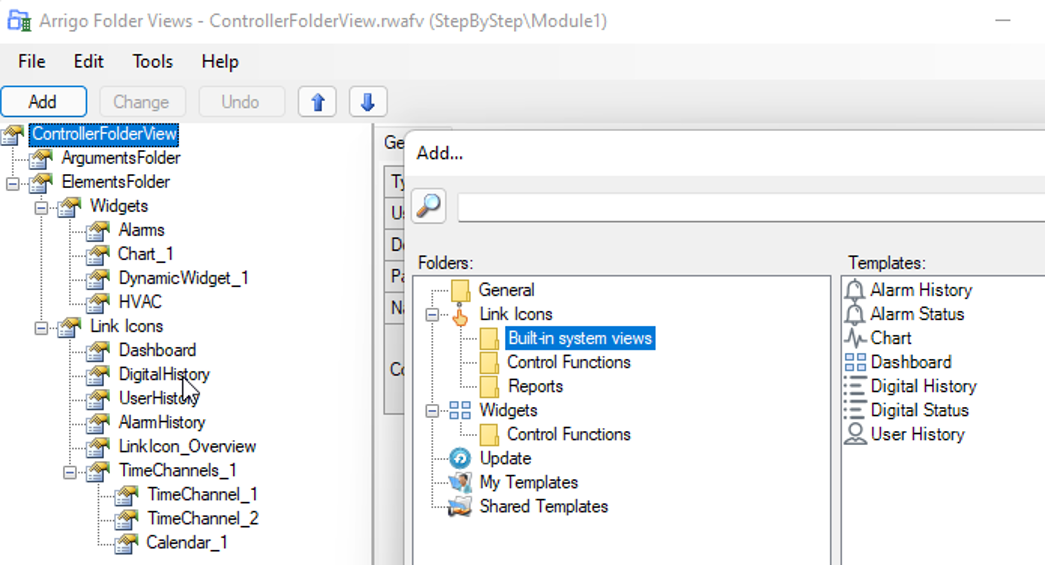
Insert Link Icon
- Choose “Arrigo Folder View”:
![]()
![]()
-
Choose “Add”
-
Choose “Link Icon”
![]()
-
Change the ”Name” to LinkIcon_Overwiew
-
Adjust the “Title” to Overview
-
Set “Show title” to Yes
-
At “Icon” choose “preview”
-
Create a new view at “File” and name it “Overview.Rwav”
![]()
- Choose File save to save the “Arrigo Folder views”
Your first Link icon with an empty Animation View has been created:
![]()
When you click on it in the browser, you will go to the window to be filled in.
You can also configure that you click on a Widget and then go to that window.
-
Select “HVAC” under the Widget heading
-
At “Open View file” choose “Select a view from this user area”
![]()
-
Select the file “Overview”
-
Choose File save to save the “Arrigo Folder views”
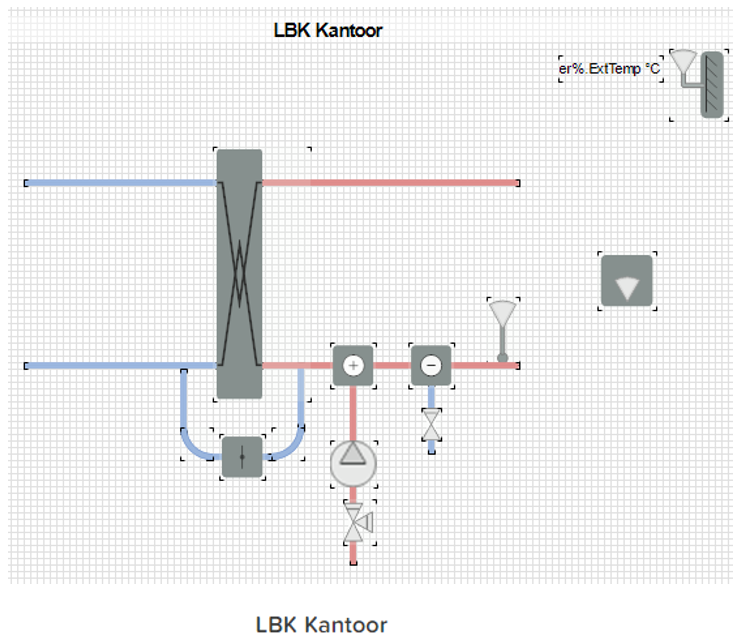
Create animation view
We are now going to fill the Animation View with data from our exercise.
-
Right click on the text “Open view file” when you have selected the Widget or right click on “File” when you have selected the Link icon. The “View Designer” opens.
-
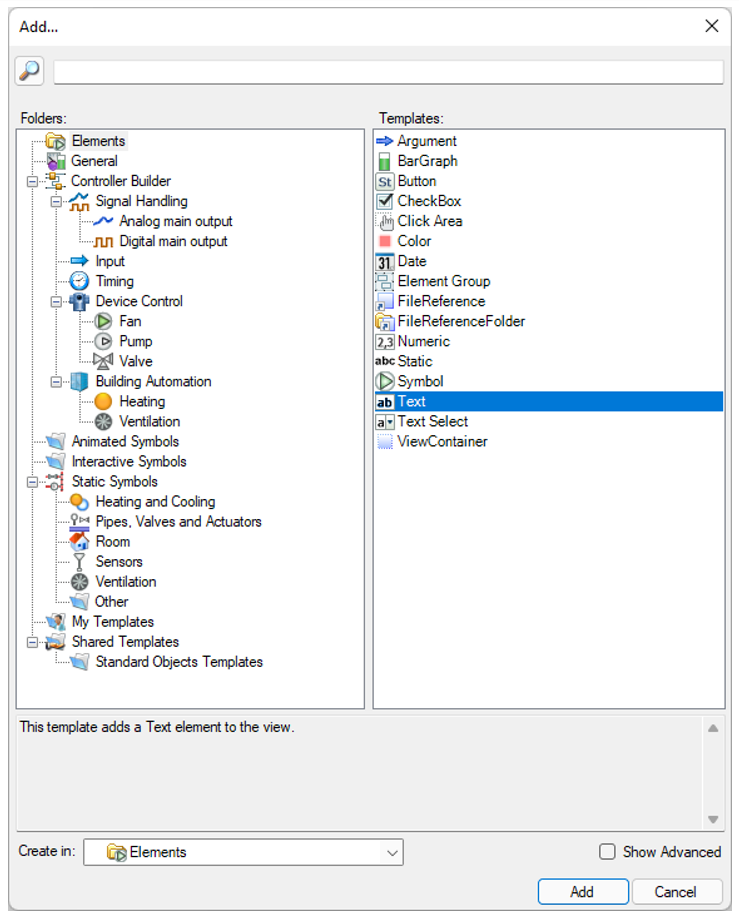
Under “Add” you will find all the elements to be added, such as the most used ones:
-
Element Group for grouping components such as lines for the background
-
Text for texts in the view
-
Numeric for values such as temperatures
-
Symbol for showing symbols of, for example, the pump
-
Text Select to display text based on a variable's status
With Templates you can also insert standards here. Make it identical to your block in Controller Builder and you'll work faster.
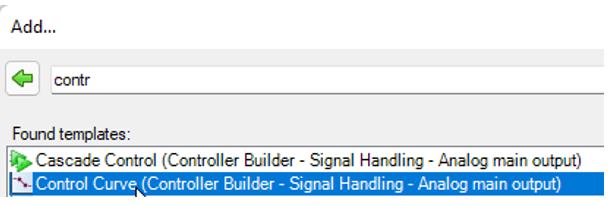
At the top of the “Add tool” you will find the search bar for filtering.
-
-
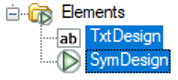
Remove the 2 default elements above the left
- Choose under add Text
-
Change the “Name” to Text_Overview
-
Set “Show title” to “No”
-
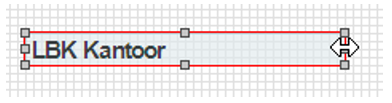
Fill in at "Value" LBK Office
-
Set the field as desired in the “Appearance” tab. You can expand the field in the left pane of the tool.
-
Choose file save and refresh the image in the browser with F5 We are now going to fill the rest of the window with data from the StepByStep exercise.
-
Add a symbol under “Add”
-
Change the “Name” to Symbol_ExtTemp
-
At pictures, choose “Pick a picture from the application library..”
-
Choose in the folder Sensors ”“ OutdoorSensor.svg ”
-
Place the symbol at the top right of the picture
-
Add a “Numeric”
-
Name the ExtTemp
-
Set “Show Title” to “No” or enter a title (TagCode)
-
Browse (dots in the right field) at “Value” to Analog Inputs and select ExtTemp
-
At “Unit” select the ° C sign
-
At “Decimals” choose “1”
-
Set “Tolerance” to Low
-
Add the numeric to the Symbol
-
Set the desired font size, color and alignment in the “Appearance” tab
Going to add pipes now
-
At “Add” choose an “Element group” and name it Ledingwerk. In it, add all the components below.
-
At “Add” under “Static Symbols – Pipes, Valves and Actuators” choose the “pipe” and choose “Next”
-
Leave everything checked and choose “Next”
-
Choose the color blue and choose “Finish”
-
Add red pipes
-
Add a “Ventilation Exchanger” which can be found under “Buiding Automation – Ventilation”
-
In the wizard, choose Cross and press “Add”
-
Leave the field at the Title blank and press “Finish”
-
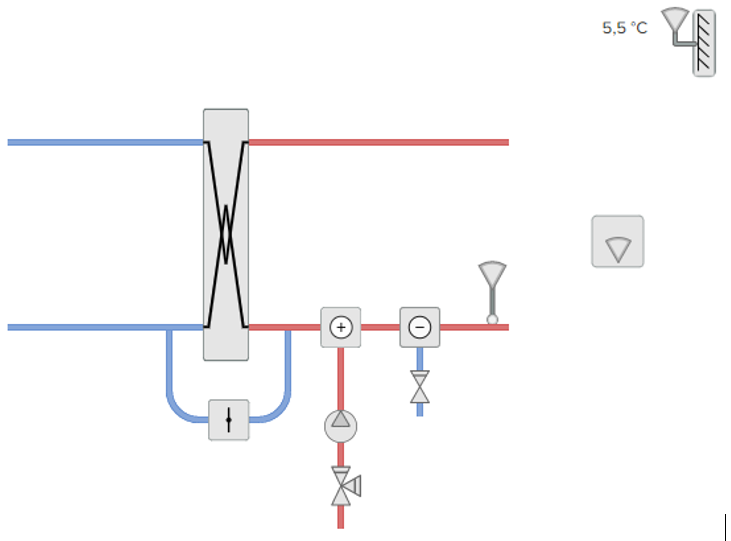
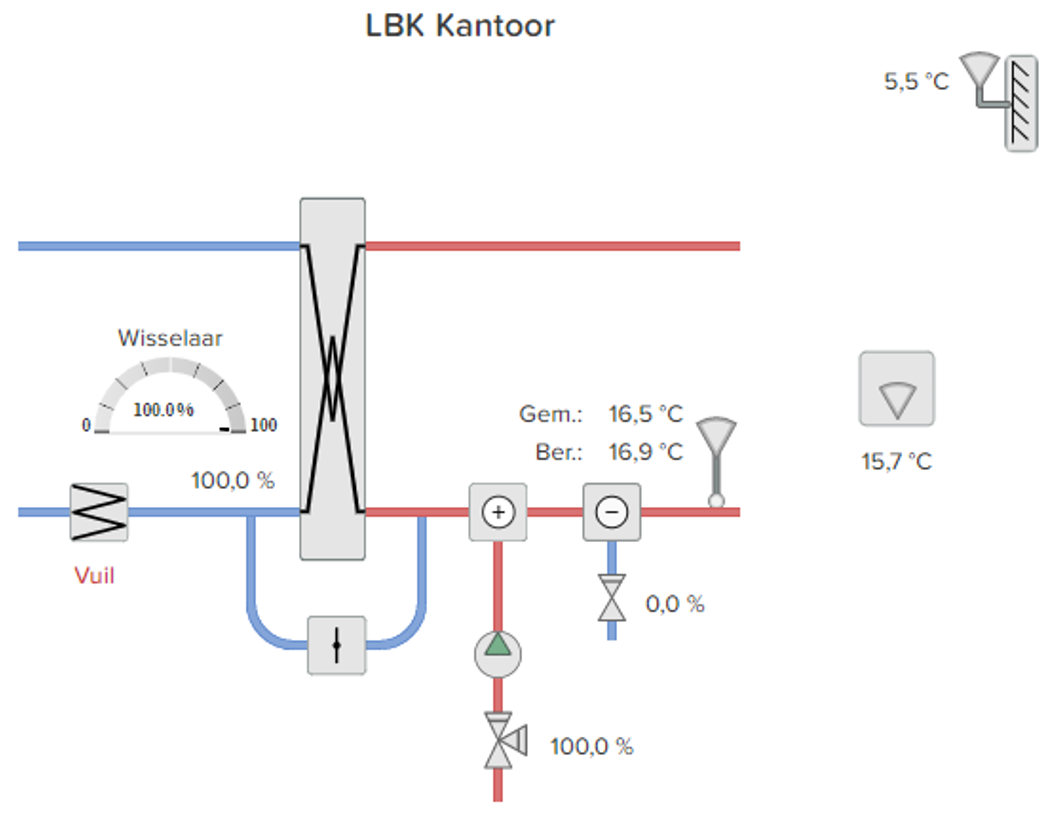
Add the rest of the parts so that you have the following picture complete.
Pipes can be changed from horizon to vertical by switching the number of Width and Height in the “Appearance” tab. Set the picture rotation to 90°.
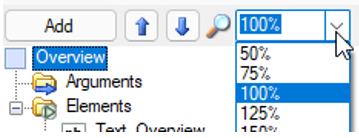
At the top left you can zoom in-out:
With Ctrl-L you can copy and paste (duplicate) with 1 action
Ctrl-R is rotate by 90°
With the arrow keys you can move in small steps
Bring to front - background is determined by the order in the left tree
Try the options in the “Appearance” tab
-
Add the different variables like among others:
o Inlet temperature
o Room temperature
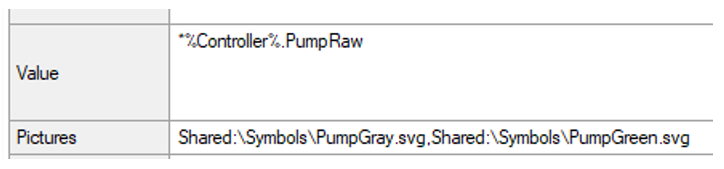
o Pump, let it color gray | green
 o Heating demand 0-100%

 o Cooling valve, use the “Raw” value, the actual output after manual operation

 o Exchanger demand, the “Raw” value
And check out Controller Builder some more. Have fun!
With F5 you refresh the page in runtime if you have done file save in View Designer.
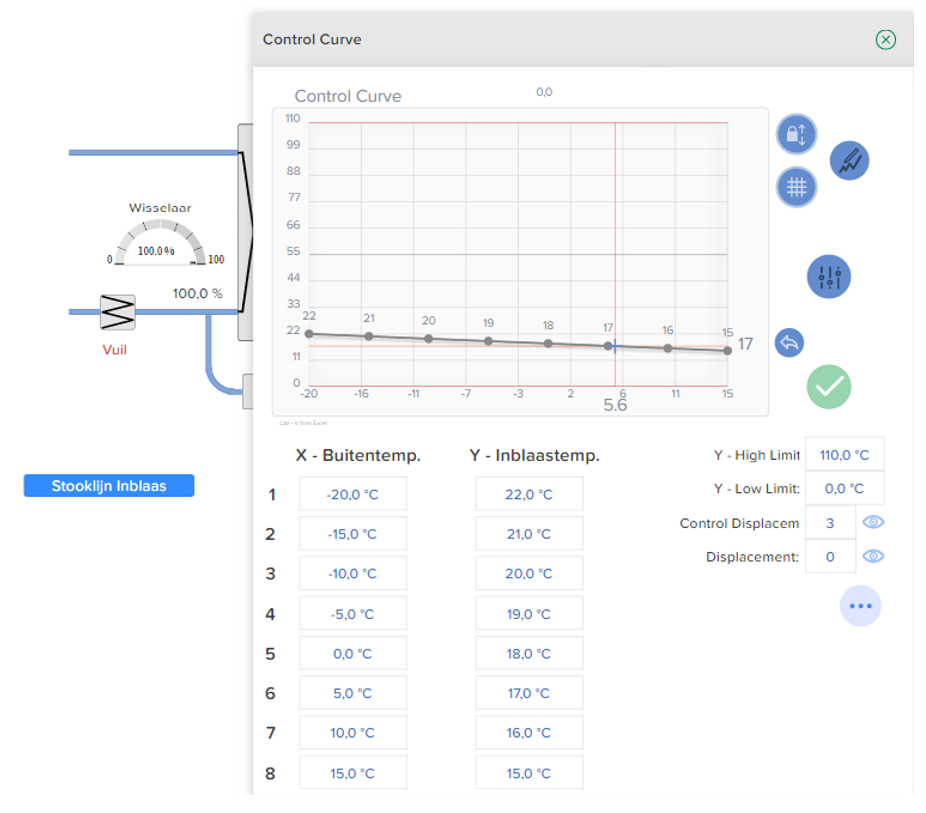
- Add a button for setting the heating curve.
Insert Time Channel
We will call the time scheduler via a “Link Icon”
-
Open the “Arrigo Folder View” tool
-
Under the heading “Link Icons” you will find the default added “TimeChannel”. You may remove it.
-
You may also delete the “Calendar”
-
Go to “Left Icons” and press “Add”
-
Select the first scheduler:
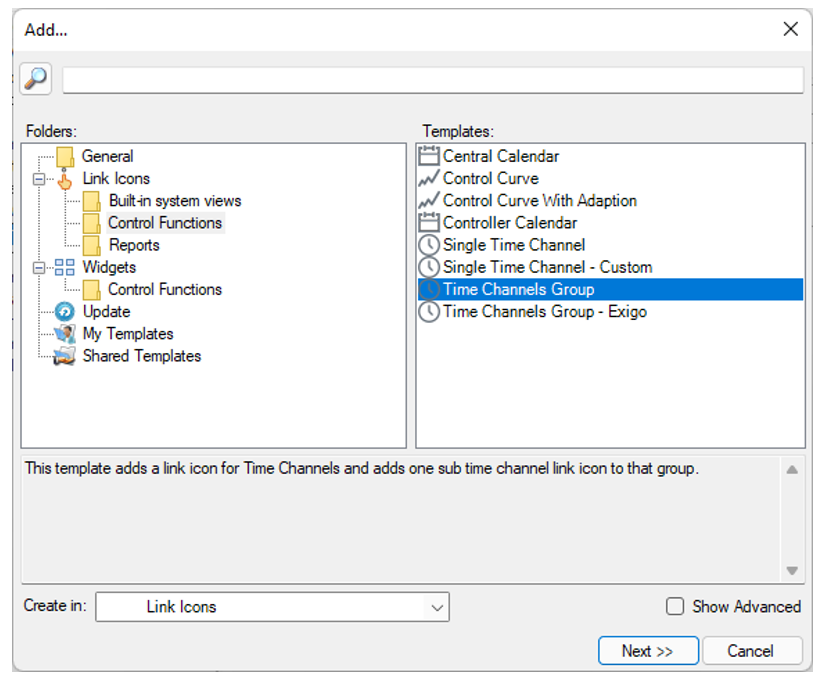
- Click “Next” at the questions and give the clock program the title LBK Kantoor.
-
Now add clock only then choose “Single Time Channel”
-
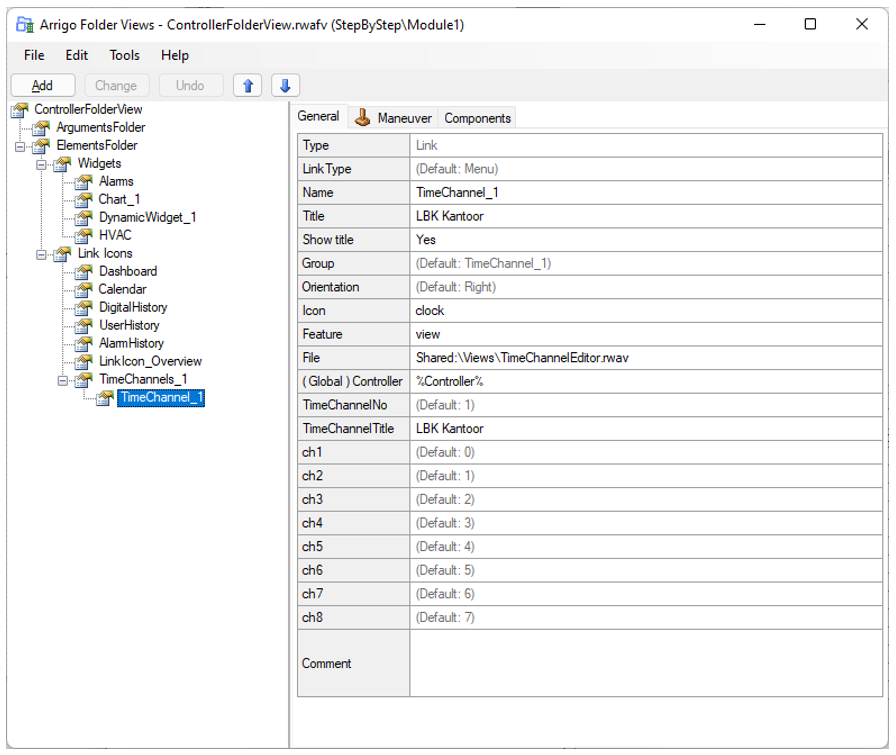
At “Time Channel Number” choose no. 2.
-
The “Title” becomes “Pump Test”
-
Also add the “Controller Calendar” for the holiday program
-
Set “Show title” to Yes and adjust the “Title” to, for example, “Holiday schedules”
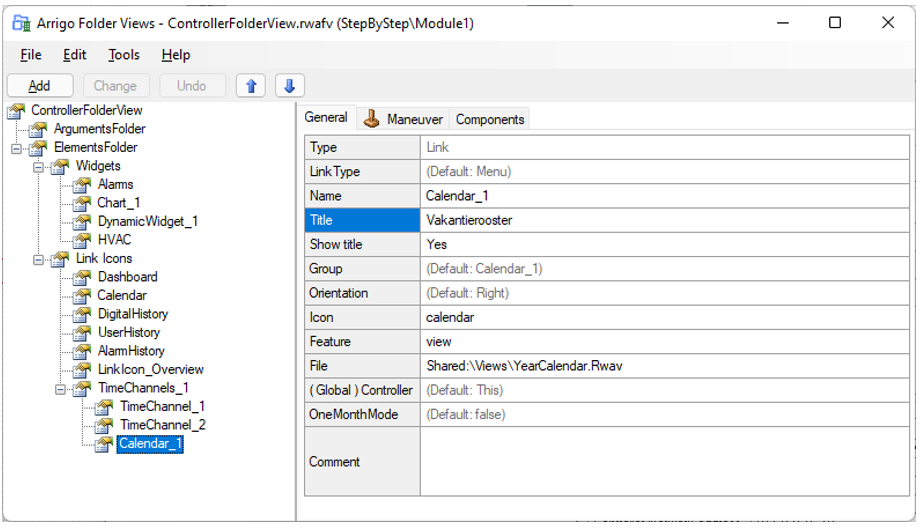
- Choose File save and test the clock program and calendar
Templates
In the “Arrigo Folder Views” you can add various templates. Several have already been added to the StepByStep project.
You can adjust the layout and icons to your liking.
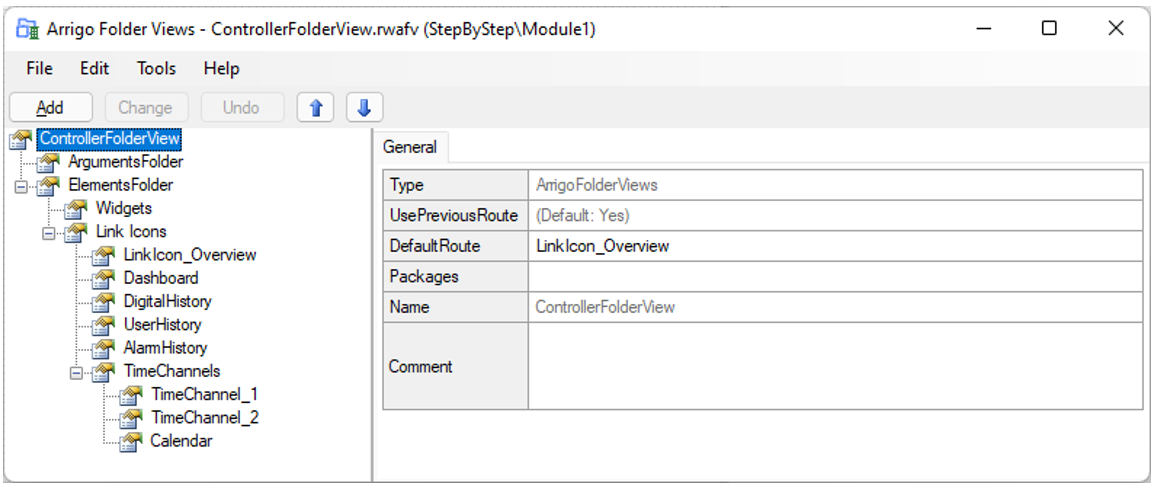
Dashboard is the link to the Widget page.
If you want to go directly to the animated view and not via a widget, you indicate at Default Route the Link to which you want to jump.
Clear the Widgets.
Historical charts
As you can see, the Widget Terns chart at the top right is not filled. We are now going to configure this.
-
Open the “Arrigo Folder View” tool
-
Click “Chart_1” on the left
-
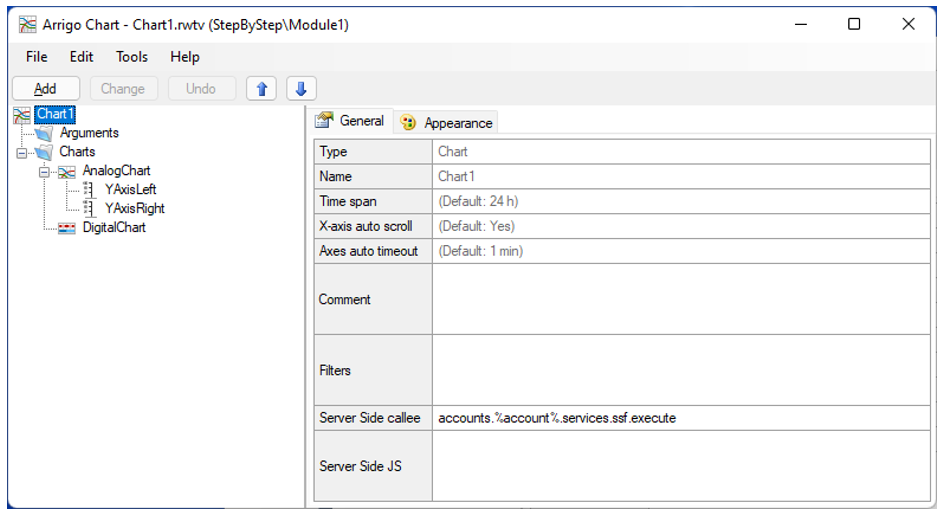
Open the “Widget File” by clicking on that text. The Arrigo chart tool opens.
-
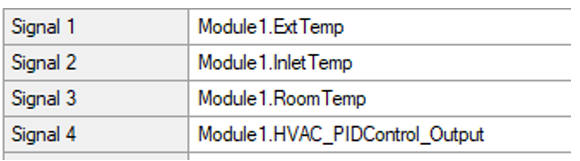
You can configure analog and digital signals created either in the logger tool or as a D-event in EXOdesigner – Project Builder. In our StepByStep we only have analog signals. Open Module1's Logger tool
-
Choose “Add” in the Arrigo chart tool
-
Choose an “Analog Signal”
-
Adjust the “Name” to “ExtTemp”
-
“Signal” becomes “%Controller%.ExtTemp”
-
“Title” becomes “Outside temperature”
-
“Unit” becomes °C (Alt-248 is ° sign)
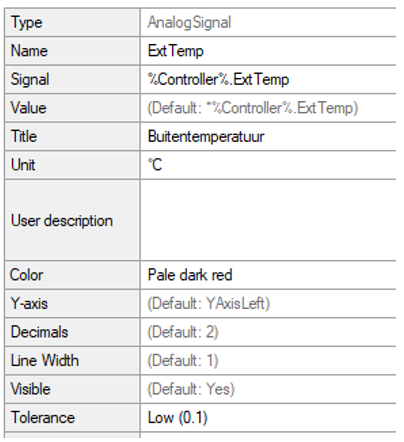
-
At the “YAxisRight” adjust the “Unit” to % as on the left is the axis in °C and on the right in %.
-
Add the other signals from the logger tool
-
Choose File and save to test your configuration.
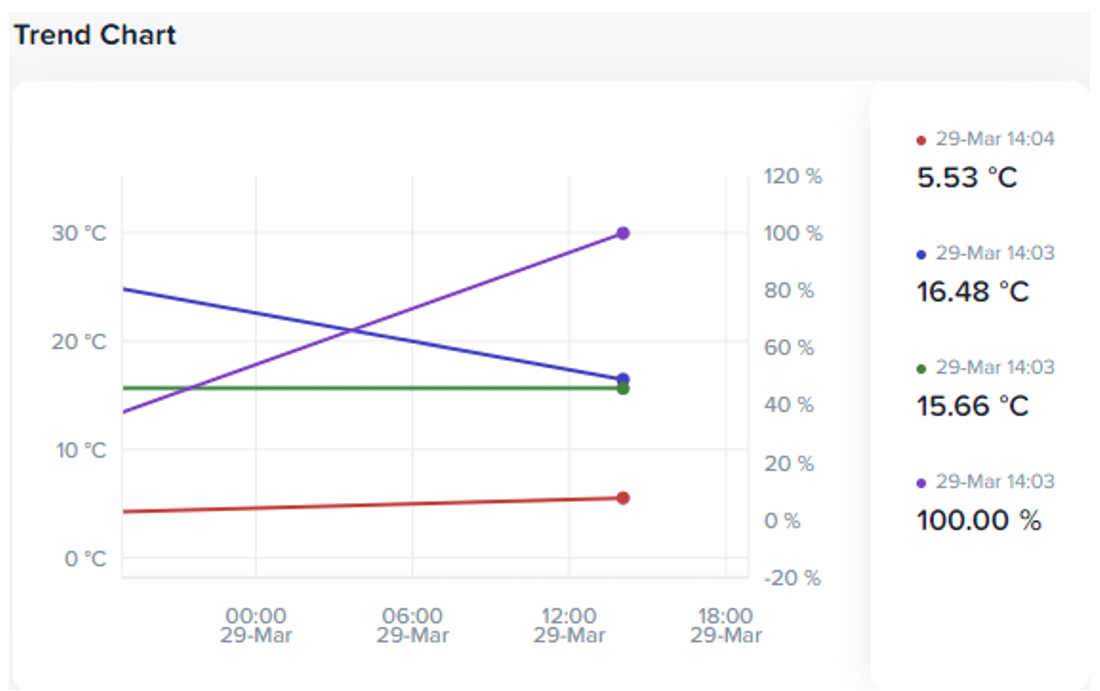
When you click on the Widget the chart window opens and you can also add realtime chart signals and alarms.
Tree structure left
To get multiple levels to the left, in addition to adding controls, you can also add areas.
-
Go to EXOdesigner – Project Builder
-
Adjust the “Title” of the controller to “AHU Office”
-
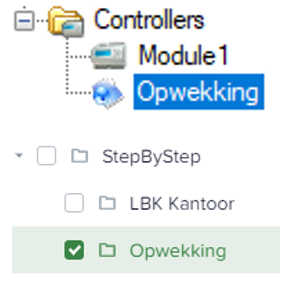
Click on Controllers and add an “Area”
-
Rename it to “Revival”
Arguments
An argument is a text that you can enter when opening a page (widget, link or chart or…). This allows you to use 1 picture for several.
For example, if you have room controllers in your project, you can refer all room controllers there with a different title with 1 picture in, for example, the shared folder.
In this StepBystep we will give the title when opening image.
-
Open the “Arrigo Folder Views” tool
-
Choose HVAC and open the view “Overview.Rwav”
-
Press “Add” and add an argument
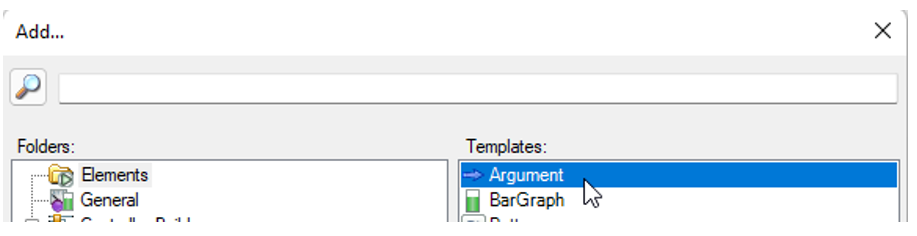
-
Change the name to “Title_Overview”
-
Select the text “LBK Office”
-
Change the “Value” field to “%Title_Overview%”
-
Close the window and save
-
In the “Arrigo Folder Views” click on the arrow to the left of “Overview.Rwav”. There, choose “refresh arguments”. The Title_Overview field is added
-
Enter “LBK Kantoor” in the “Tiel_Overview” field
-
Copy (Ctrl-L) “HVAC” and change “AHU office” to “AHU Kitchen”
-
Adjust the “Title” for both if necessary
- Choose File and Save and test the new configuration.
You can also pass an argument in the Arrigo Folder (first call Widget page) so that you immediately open a frequently used image, such as Corrigo AHUs.
Pop-up windows
We are going to add a call on a probe. We are going to pass an argument with a standard image.
-
Open the “overview.Rwav” image from “Arrigo Folder View”
-
Click on the inlet sensor
-
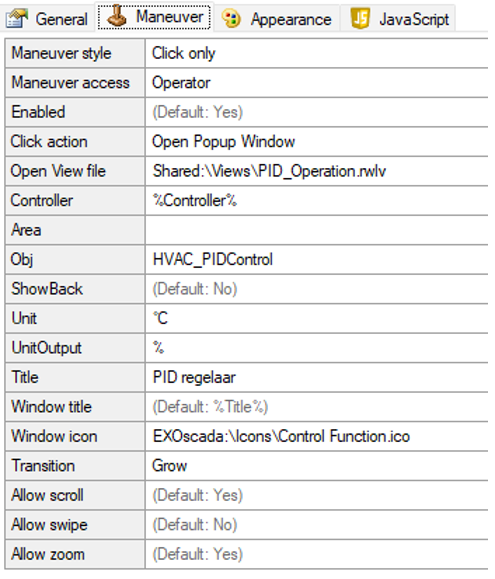
In the “Maneuver” tab, adjust the “Maneuver Style” to “Click only”
-
Adjust the “Click action” to “Open Popup Window”
-
Click on “Change”
-
At “Open View file” choose “Shared:\Views\PID_Operation.rwlv”
-
Fill in the fields under “Maneuver”
- Choose File Save and test your addition
You can now make your own pop-up window for, for example, setting an analog output with arguments so that you can put it on the exchanger and cooling valve.
Use the variables for this:
“Output” > value in %
“Exit”ManAutoSelect > text select hand off,hand on,auto
“Output”Man > adjustable value in %
“Output” Raw > value in %
And add a text or picture to your overview so that you can see that you have that exit on hand. The ManAutoSelect and when value is 2 show nothing, so leave that text or Symbol empty.
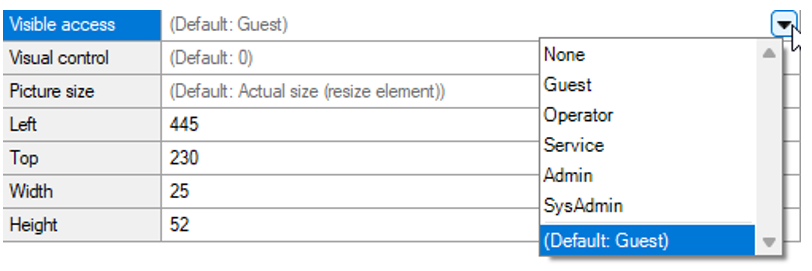
You can have a text colored by means of a variable.
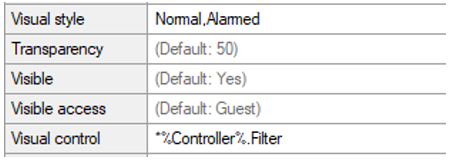
The “Visual style” and “Visual control” can be found under “Appearance”.
Access Level
In Arrigo runtime you have 5 login levels. You can indicate per user what the level is, what they are allowed to do.
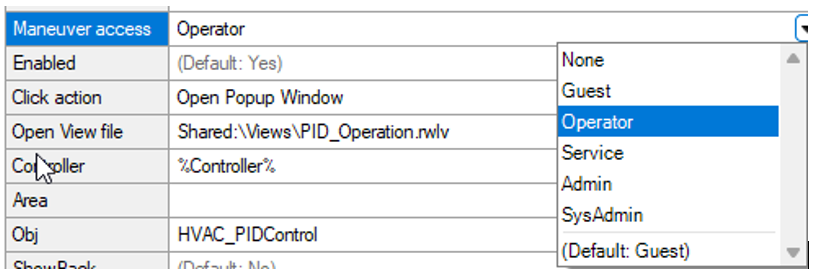
You can also determine for each item what the access level is to show that element. This can be found under the “Appearance” tab.
When creating a user at runtime, you configure the login level.
Reports
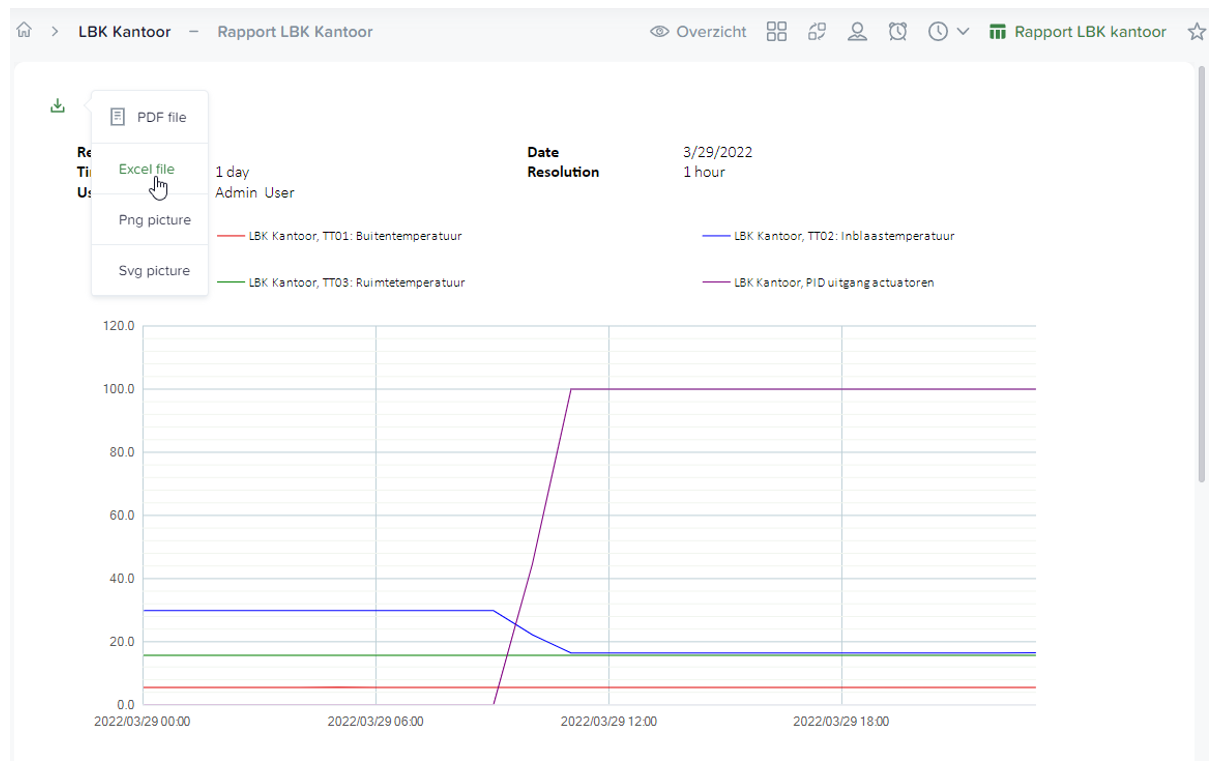
The report generator window is very similar to the historical graph window. The big difference, however, is that the Report Generator works by pulling stored data from the database and generating a picture of it before it goes to the browser (frontend). This makes the report generator a lot faster than the historical chart, but it doesn't work with live update.
To add the template for the report generator window and generate some report data, do the following.
-
Go to the “Arrigo Folder Views”
-
Select on Link Icons
-
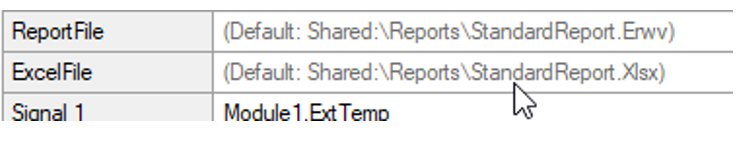
Under the folder on the left “Reports” choose the template “Standard report view”
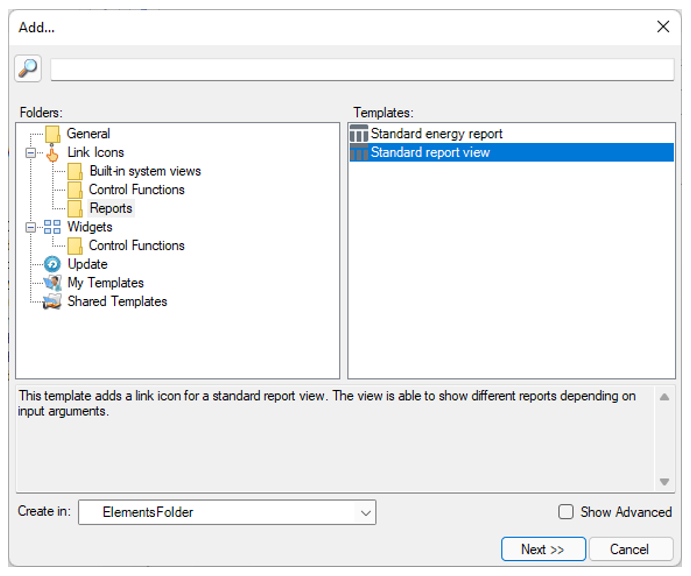
-
Choose next and fill in "LBK_Kantoor" at "Name of View"
-
Change the “Title” to “Report AHU office”
-
Set Show Title to Yes
-
Fill in the variables that exist in the logger tool for the signals
- Choose “File” and “Save” and test in the browser
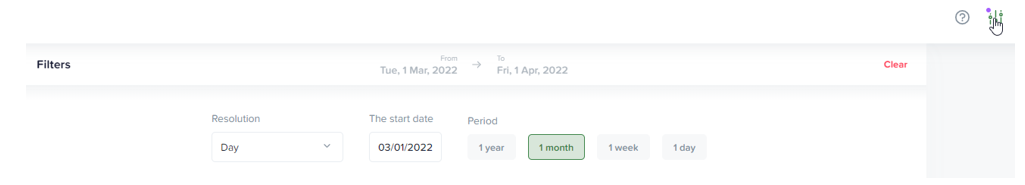
Show your filter, button at the top right, so that you can show the current month.
Adjust configurations in the template and see what it does in the browser.
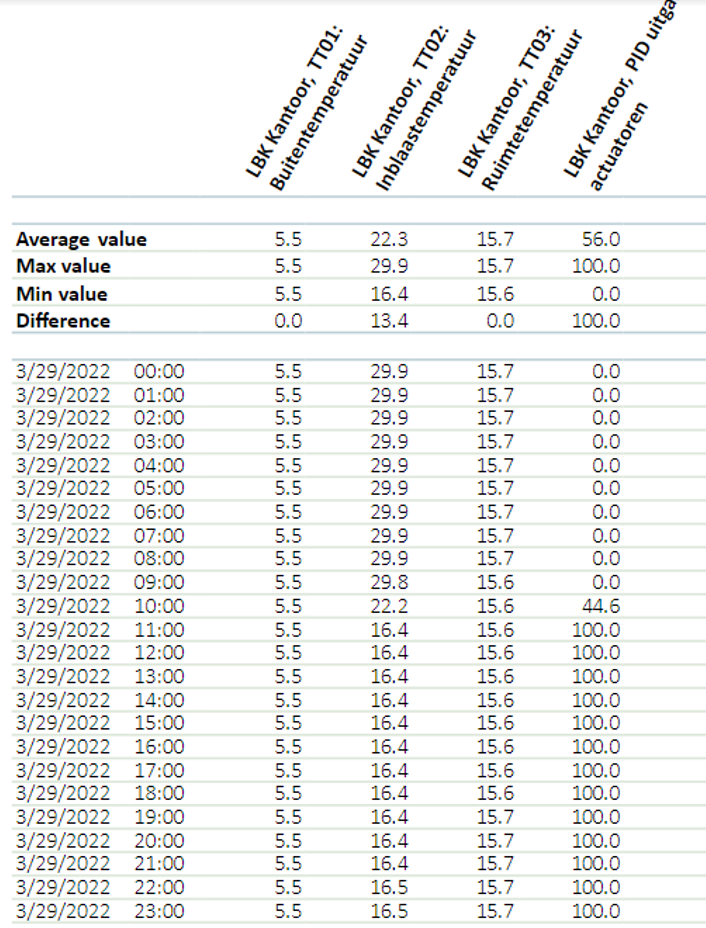
You can also adjust the Excel template to your liking.
Home page after login
To edit Widgets from the home page after logging in, go to the StepByStep project in EXOdesigner and open the “Arrigo Folder Views” there.
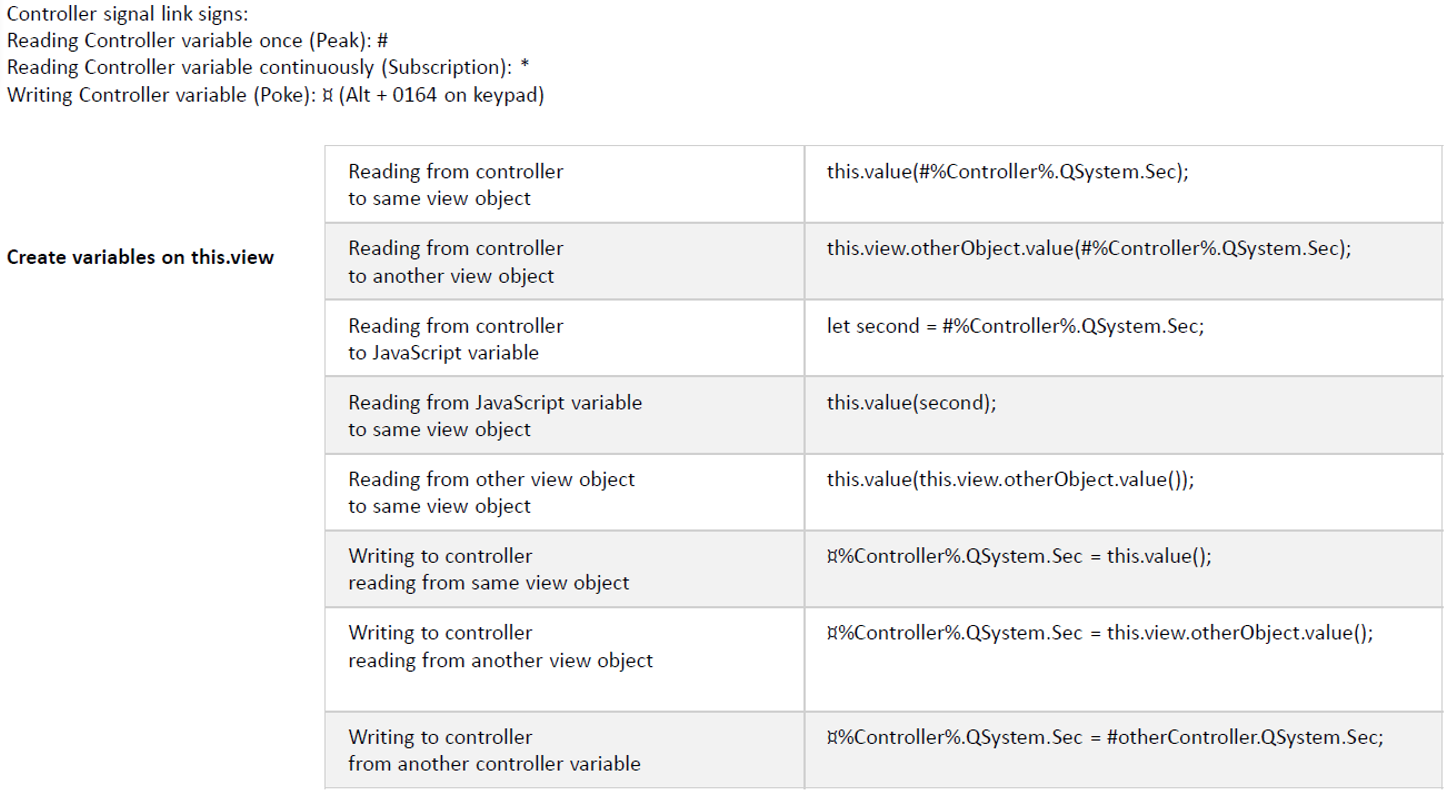
JavaScript
In the Arrigo animated view you can read and write variables of elements with javascript. You can also read or write values from controllers.
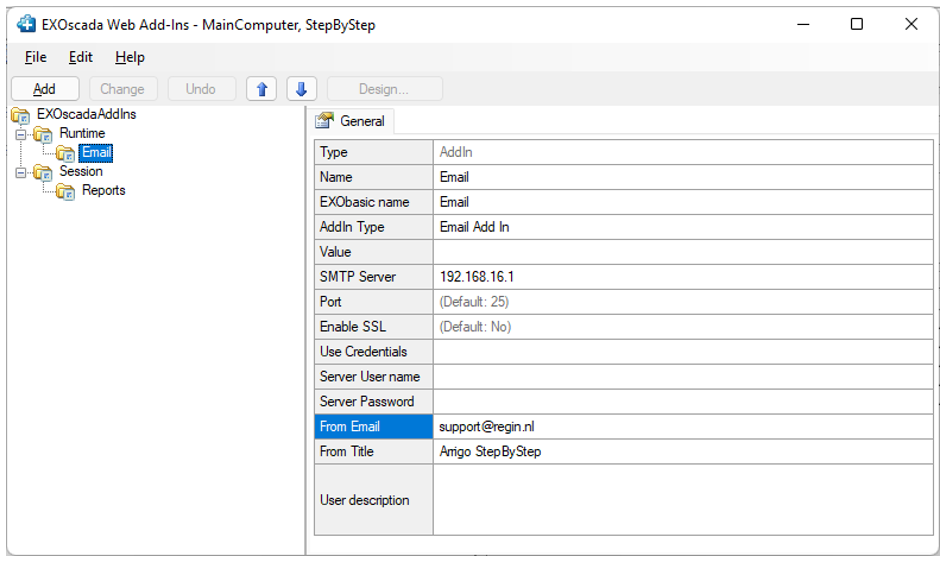
Email notifications
You can select per user whether and which priority and status you report an alarm via email.
As a developer you must do the configuration so that e-mails can be sent.
You make the settings per user in runtime in the user configuration, see manual Arrigo.
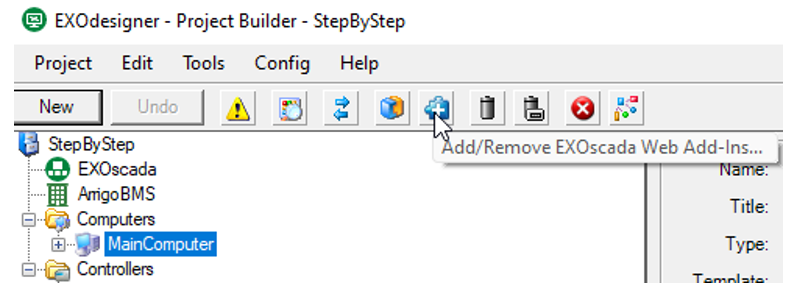
To configure the mail function in Arrigo, go to “MainComputer” in “EXOdesigner – Project Builder”.
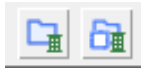
- Click on the Icon “Add/Remove EXOscada Web Add-Ins” or via pulldown menu Tools
- In the Tool press “Add” and select a mail template
Depending on the IT environment where Arrigo runs, you choose a template and you must fill in data.