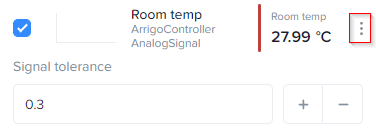
Tolerance values in Arrigo BMS
The algorithm employed for reducing the number of samples in analog signal trend charts is known as the Ramer–Douglas–Peucker algorithm. In essence, this algorithm identifies pivotal points crucial to defining the overall curve and eliminates unnecessary intermediate points, thereby reducing the number of plotted points while maintaining the general appearance of the curve.
The tolerance value plays a key role in this process, determining the width, or thickness, of the "pipe" that scans the curve. Points within this pipe are deemed redundant and are discarded, as they do not contribute significant information, while others are retained.
To illustrate, a tolerance value of 0.5 signifies that, as the algorithm scans the curve, points falling within half the tolerance range (±0.25) are discarded. This allows for a more streamlined representation of the curve without compromising its essential features. The visual representation of this process is demonstrated in the following animation:

Media source: https://upload.wikimedia.org/wikipedia/commons/3/30/Douglas-Peucker_animated.gif
Adjustments to the tolerance may be necessary based on the unit of the signal. While the default value of 0.5 is effective for temperature signals, it might require adjustments for signals expressed in different units such as mg/l, m³/s, and others. Fine-tuning the tolerance, either lower or higher, becomes essential, particularly for signals with small changes requiring a lower tolerance or those with more substantial variations demanding a higher tolerance.
The tolerance is set either using the Arrigo Chart tool or by overriding default values on a per-unit basis within the theme file. This enables users to tailor the algorithm's sensitivity to suit the specific characteristics of the signal, ensuring optimal representation and accuracy in all unit scenarios.
Users can also adjust the tolerance value directly in the trend view, but please note that these adjustments are not saved. Open the context menu and select Settings to access the tolerance value:
Digital signals
The algorithm for limiting the returned number of digital signals also involves a tolerance value, although this cannot be changed through configuration.
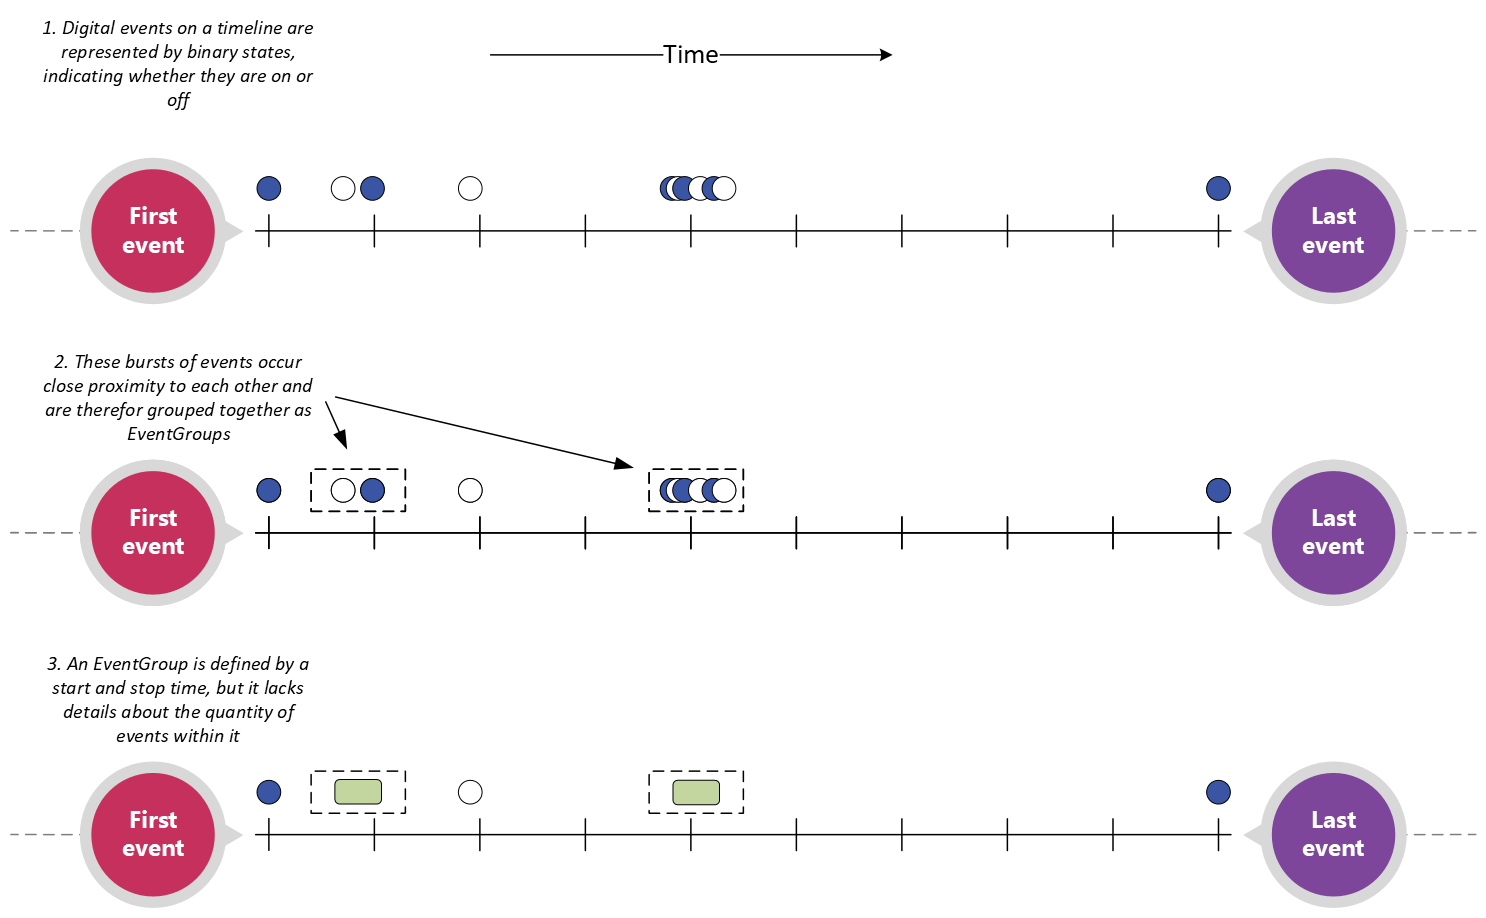
In essence, the algorithm evaluates temporal relationships between events within a sequence of events. Events that occur close to each other in time, based on the overall timespan, are replaced with an Event Collection: