Introduction
The CO₂ Emission-widget is visualizing the amount of CO₂ Emissions from a selected Building/Meter or Folder.
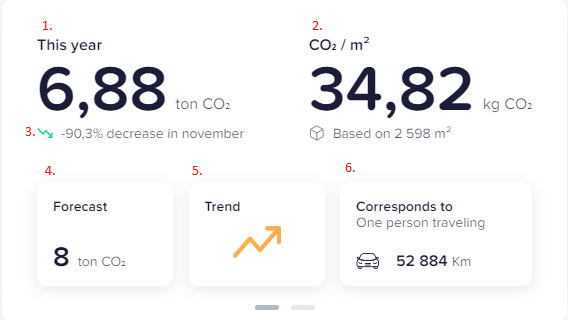
- Total CO₂ Emissions of current year.
- Total CO₂ Emissions of current year/m2 of the total A-temp area for the selected Building or the summarized A-temp area for all buildings below the selected Folder.
- Trend and change from previous month compared to the month before. (e.g. November compared to December).
- Forecast for current year.
- The trend for total CO₂ Emission on previous year <-> Forecast for current year.
- Total CO₂ Emissions of current year in relation of driving a car. (calculated on 130g CO₂/km).
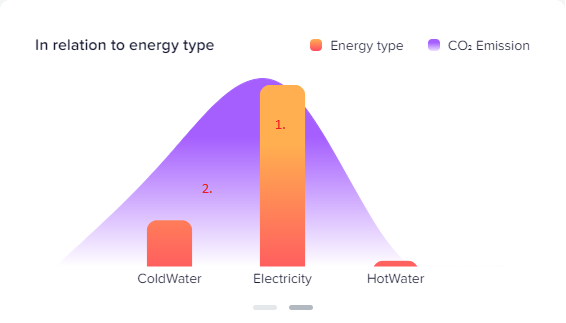
- Consumption per Energy type.
- CO₂ Emissions per Energy type.