Getting weather forecasts
Introduction
In this part of the ServerSideFunctions tutorial we'll use the Fetch context object once again, but this time we're something slightly more useful: presenting weather forecasts in a view.
We will be accessing the open API from SMHI (The Swedish Meteorological and Hydrological Institute) to get the forecast for the next 10 days in Stockholm, Sweden. For simplicity we will only display the next upcoming three hours.
Note
The complete view can be downloaded from here, but you will still need to follow some of the setup steps for it to work.
Setup
- In SSF_Tutorials, create a new
User Areacalled WeatherForecasts. - Open Folder Views Tool and remove all the default
WidgetsandLink Icons. - Create a new
Link Iconand leave the default name as is (UnnamedLinkIcon_1).
In the File attribute, select Create a new view in this user area..., change the name to WeatherForecasts.Rwav and save the the changes in Folder Views Tool.
Open the newly created view for editing.
- Remove the default elements.
- Add three
Textelements with the names InOneHour, InTwoHours and InThreeHours. - Save the file.
In your browser, navigate to the new User Area and make sure the elements display correctly.
Adding the server-side code
In the view root object, on the Javascript tab, open up the ServerSideJS editor and paste the following code:
return {
    getForecast: async (args, callInfo) => {

        // The centre of Stockholm (Sweden) is at
        // latitude 59.3293° N and longitude 18.0686° E
        const url =
          "https://opendata-download-metfcst.smhi.se/api/category/pmp3g/version/2/geotype/point/lon/18.0686/lat/59.3293/data.json";
        const response = await callInfo.context.fetch(url);

        // Convert the response to an object
        const forecast = await response.json();

        // The forecast object is basically a list of timeSeries objects,
        // where each item contains a list of parameters
        // (temperature, precipitation, visibility etc.).
        //
        // For this example we have already asserted that
        // the temperature is stored at index 10.
        // We then get the first value from that entry.
        const inOneHour = forecast.timeSeries[0].parameters[10].values[0];
        const inTwoHours = forecast.timeSeries[1].parameters[10].values[0];
        const inThreeHours = forecast.timeSeries[2].parameters[10].values[0];

        return { inOneHour, inTwoHours, inThreeHours };
    }
}
Warning
We are now relying on the internal ordering of the returned data. This could be changed by the publisher of the API without notice, and then the code would fail.
A better approach would be to loop through all parameters (for a timeSeries) and get the entry with the name "t" (temperature).
Tip
If you are curious about the API, the parameters and the returned forecast object, you can find more information at SMHI.
Adding the client-side code
Open the OnOpen editor for the root object and paste the following code:
this.view.call('.getForecast', {}).then((result) => {

    // Simply return without doing anything if the request failed
    if (result === undefined) {
      console.error('Failed to get forecast');
      return;
    }

    // Using a Template String to concatenate the value and unit
    this.view.InOneHour.value(`${result.inOneHour}°C`);
    this.view.InTwoHours.value(`${result.inTwoHours}°C`);
    this.view.InThreeHours.value(`${result.inThreeHours}°C`);
});
The result
Open your browser and navigate to the area. When your view loads it should look like this:
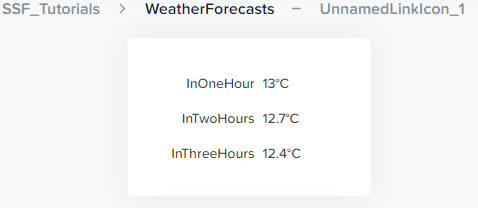
A new forecast is published each hour so make sure to reload/revisit the page after a while.
Quick review
In this part we fetched some slightly more complicated data. Feel free to change the position (lat/long) to somewhere more relevant if the weather in Stockholm, Sweden doesn't interest you that much.
Ideas and improvements
First of all you could make the position (lat/log) selectable in i TextSelect element. You could map city names to coordinates to create a more user-friendly experience.
And there is quite a lot more data in the forecast that could be useful. For example, you can get a number that represents a weather symbol which you then bind to a Symbol element. Please note that you have to create your own symbols/pictures as they are not provided by SMHI.