Application logging configuration
Introduction
All the applications/components that make up Arrigo Local produce log files. You can find most of them in the %ProgramData%\Arrigo\Arrigo Local\logs directory.
When things in the system don't work as expected these log files are inevitable.
The seasoned Arrigo Local administrator has probably already configured the log settings manually (in the backing config files) to enable debug logging etc.
But doing this requires some knowledge of the structure of the file, and a tiny mistake could lead to even more problems.
In v1.0.239 we added functionality to edit these settings using the API.
This ensures that the log settings are formatted properly, but you still have to have knowledge of what the usable log levels are etc.
Wouldn't it be even better to have a view where these settings could be configured and where we're guaranteed that they are written in the correct format?
All the previous sections of this tutorial have focused on introducing one specific feature of SSF.
This time we will instead create quite a complex view using a mix of SSF and client-side scripting, that accesses the Arrigo Local API to get and set the logging configurations.
And since this view contains so much code, we will only look at some specific parts which are slightly more interesting.
Note
The complete view can be downloaded from here, but you will still need to follow some of the setup steps for it to work.
Setup
- In SSF_Tutorials, create a new
User Areacalled ApplicationLoggingConfiguration. - Open Folder Views Tool and remove all the default
WidgetsandLink Icons. - Create a new
Link Iconand leave the default name as is (UnnamedLinkIcon_1).- Change the
Maneuver/Accessattribute to SysAdmin to prevent unauthorized use of this functionality.
- Change the
In the File attribute, select Create a new view in this user area..., change the name to ApplicationLoggingConfiguration.Rwav and save the the changes in Folder Views Tool.
Copy the downloaded view into the User Area, overwriting the existing file.
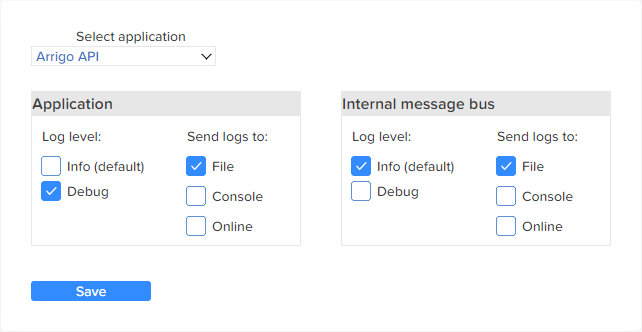
In your browser, navigate to the new User Area and make sure the view is displayed correctly:
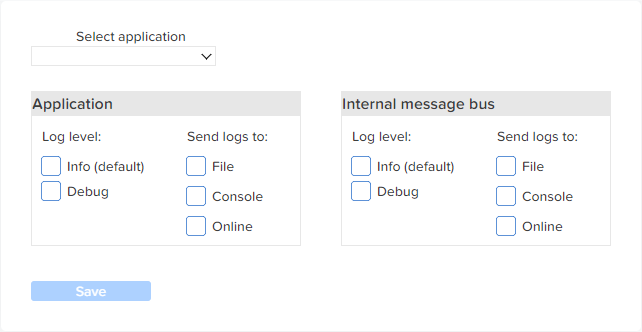
Functionality
Use the TextSelect element to select which application to change settings for:
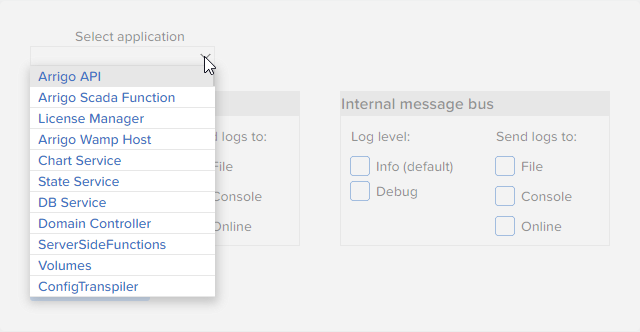
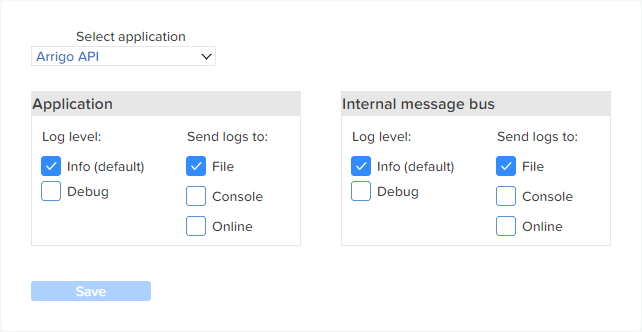
Once selected, the settings for that application will be fetched from the API and the checkboxes will be updated accordingly:
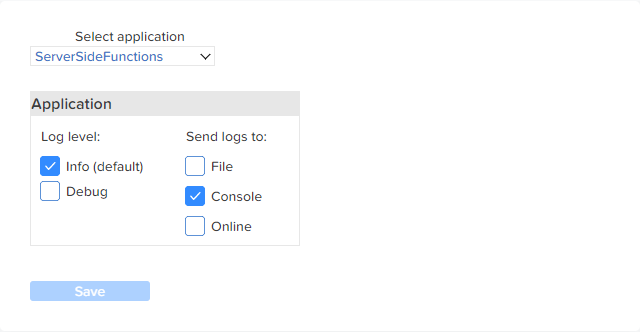
Some applications do not have a separate Internal message bus setting, so selecting one of these applications will hide the element group:
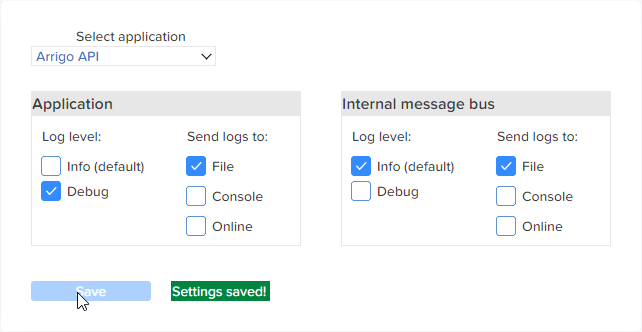
If you change one of the settings, the Save button will become enabled:
If you were to change back to the initial state, the button is disabled.
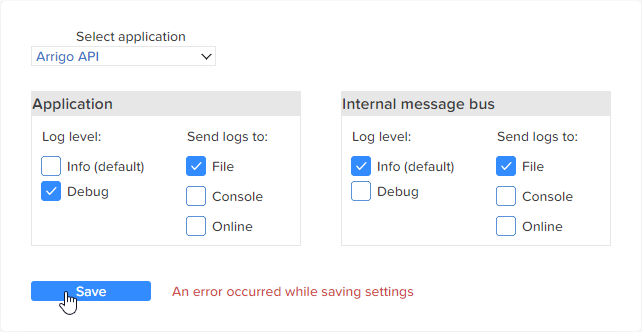
Press Save to commit the changes to the log settings files. A message will be displayed to indicate whether the changes were successful or not:
Log levels and targets
I think we need to take a couple of minutes to explain what we're looking at.
For each application there are two different sections of the configuration:
- The actual application
- The internal message bus, which all applications use.
Both sections have the same available settings, which are divided into Log level and Send logs to (the target).
The log levels are pretty self-explanatory:
- Info will log informational messages and errors. This produces the least amount of information.
- Debug will log basically everything and produces quite a lot of information in a short time.
"So when should I enable the debug logging?"
When we tell you to do so, during a support session. Leaving the log level set at Debug could potentially result in hundreds of megabytes of log data being stored every day.
The log files are rotated so you will never have more than 10 log files per application, but beware anyway.
The log targets control where to send the log data:
- File appends to the log file of the application.
- Console sends the output to the console. This is sometimes useful when troubleshooting and doesn't use any disk space.
- Online should only be used during a support session. This option redirects the logs to our online service where we can view the logs without requiring you to send log files from the server etc.
Warning
The combination of Debug and Online should only be used when you have been explicitly instructed to do so, as this sends huge amounts of data from your server to our online service.
The client-side code
We'll start by examining some of the client-side code.
One technique heavily used in both the client-side code and the SSF is running code inside anonymous async functions:
This lets you await the result of an async function call instead of ending up with callback code that is hard to follow:
The only downside is that we have no control over when the code is run, as we execute our anonymous function at the end and exit. We only know that the code is guaranteed to run at some (very close) point in time.
When a checkbox is clicked we do a couple of clever tricks.
First we take advantage of the naming convention used in the view to find all the other checkboxes in the same category/group and deselect them.
This is done by comparing parts of the name of the current checkbox with all the other elements in the view:
// We start by getting the prefix by splitting the name of the currently clicked
// element:
// "Program_Level_Info_CB" -> "Program_Level"
const prefix = this.name().split('_').slice(0,2).join('_');

// We iterate over all the properties/entries of the parent element.
for (const [key, element] of Object.entries(this.parent)) {

    // This is the current element. Move on to the next.
    if (key === this.name()) continue;

    // If the element has the correct prefix,
    // and is a checkbox (name ending with 'CB'),
    // we set its value to 0 and thereby deselect it.
    if (key.startsWith(prefix) && key.endsWith('CB')) {
        element.value(0);
    }
}
We then send the state of all the checkboxes to a SSF to check if it differs from the currently saved setting. This is done in all the checkboxes:
// We must pass in all the state from the view so the function can
// compare them against the current settings.
const result = await this.view.call('.shouldEnableSaveButton', {
    appValue: this.view.Select_Application.value(),

    programInfo: this.view.Program_Level_Info_CB.value(),
    programDebug: this.view.Program_Level_Debug_CB.value(),
    programFile: this.view.Program_Target_File_CB.value(),
    programConsole: this.view.Program_Target_Console_CB.value(),
    programOnline: this.view.Program_Target_Online_CB.value(),

    wampInfo: this.view.Wamp_Level_Info_CB.value(),
    wampDebug: this.view.Wamp_Level_Debug_CB.value(),
    wampFile: this.view.Wamp_Target_File_CB.value(),
    wampConsole: this.view.Wamp_Target_Console_CB.value(),
    wampOnline: this.view.Wamp_Target_Online_CB.value()
});
Lastly we have the Save button which uses setTimeout to hide the status message.
This works fine even though the rest of the code is wrapped in an anonymous async function:
// Function for hiding an element.
const hideElement = (element) => {
    element.visible(false)
}

(async () => {
    // The rest of the code has been omitted for brevity...

    let element;

    // If everything went ok we make the "Save successful" element visible
    // and disable the save button.
    // Otherwise we make the "Failed to save" element visible.
    // Note that we store the displayed element so we can hide it later.
    if (saveOk) {
        this.view.Save_Success.visible(true)
        element = this.view.Save_Success
        this.view.Save_Button.enabled(false);
    } else {
        this.view.Save_Error.visible(true)
        element = this.view.Save_Error
    }

    // Use the previously defined 'hideElement' function to hide
    // the element after 3 seconds.
    setTimeout(hideElement, 3000, element);
})();
The server-side code
We first define a function for posting GraphQL queries to the API.
Think of this as a helper function that is not registered as a SSF but instead used by the other registered functions.
Please note that we can use the existing auth token from the current user to authenticate against the API.
// The url that we post queries to.
const queryUrl = 'http://localhost/arrigo/api/graphql';

// Function for posting queries to the API.
const postQuery = async (callInfo, payload) => {
    console.log('In postQuery');

    // All requests must be authenticated/authorized.
    // The callInfo object has the current token from the user,
    // so we don't have to login.
    // Also note the the payload/query must be posted as json.
    const response = await callInfo.context.fetch(queryUrl, {
        method: 'POST',
        headers: {
            'Content-Type': 'application/json',
            'Authorization': `Bearer ${callInfo.token}`
        },
        body: JSON.stringify(payload),
    });

    return await response.json();
}
Then comes the actual posting of data to the API.
We start by constructing a GraphQL query where we specify what properties of the log settings we're interested in.
In this case, we fetch all the available properties, final, logger, minLevel, finalMinLevel, name and writeTo, for later use in the rest of the logic:
// Gets the logging rules for a specific application.
const _getRulesForApp = async (appName, callInfo) => {
    console.log('In _getRulesForApp');

    // Build the query by adding the appName and requesting all the
    // available properties.
    const query = {
        query: `{
            loggingRules(appName: "${appName}") {
                final
                logger
                minLevel
                finalMinLevel
                name
                writeTo
            }
        }`
    };

    // Post the query and return the result.
    const response = await postQuery(callInfo, query);
    return response.data.loggingRules;
}
Tip
The query you just posted to the API is written using a language called GraphQL. You can find more information about the available functionality directly in the API. Log in and use one of the two built-in query builders (GraphiQL and Playground) to explore the available functionality.
Tip
Download the view and check out the rest of the code.
All the interesting stuff is commented at least once for every element, so you won't have any problem understanding the logic.
And make sure to check out the state handling (whether to enable the Save button or not) which is also done using SSF.
Quick review
In this part we combined client-side code with SSF in a much more extensive way than before. We hope you are starting to understand the possibilities that this way of developing views opens up!