Debugging
Debugging is useful when the SSF:s are getting more advanced or when the front end code in views are getting complex. To easily follow the program flow, there is the "simple" and "advanced" debugging options.
debugger - the important keyword
Anywhere, in JavaScript environments, both in the web browser and in the backend Node.JS environment, the debugger keyword halts the execution if a debugging session is active and attached to the runtime. The entire session is halted at the keyword, and call stack, local variables and global variables can be inspected.
Frontend debugging
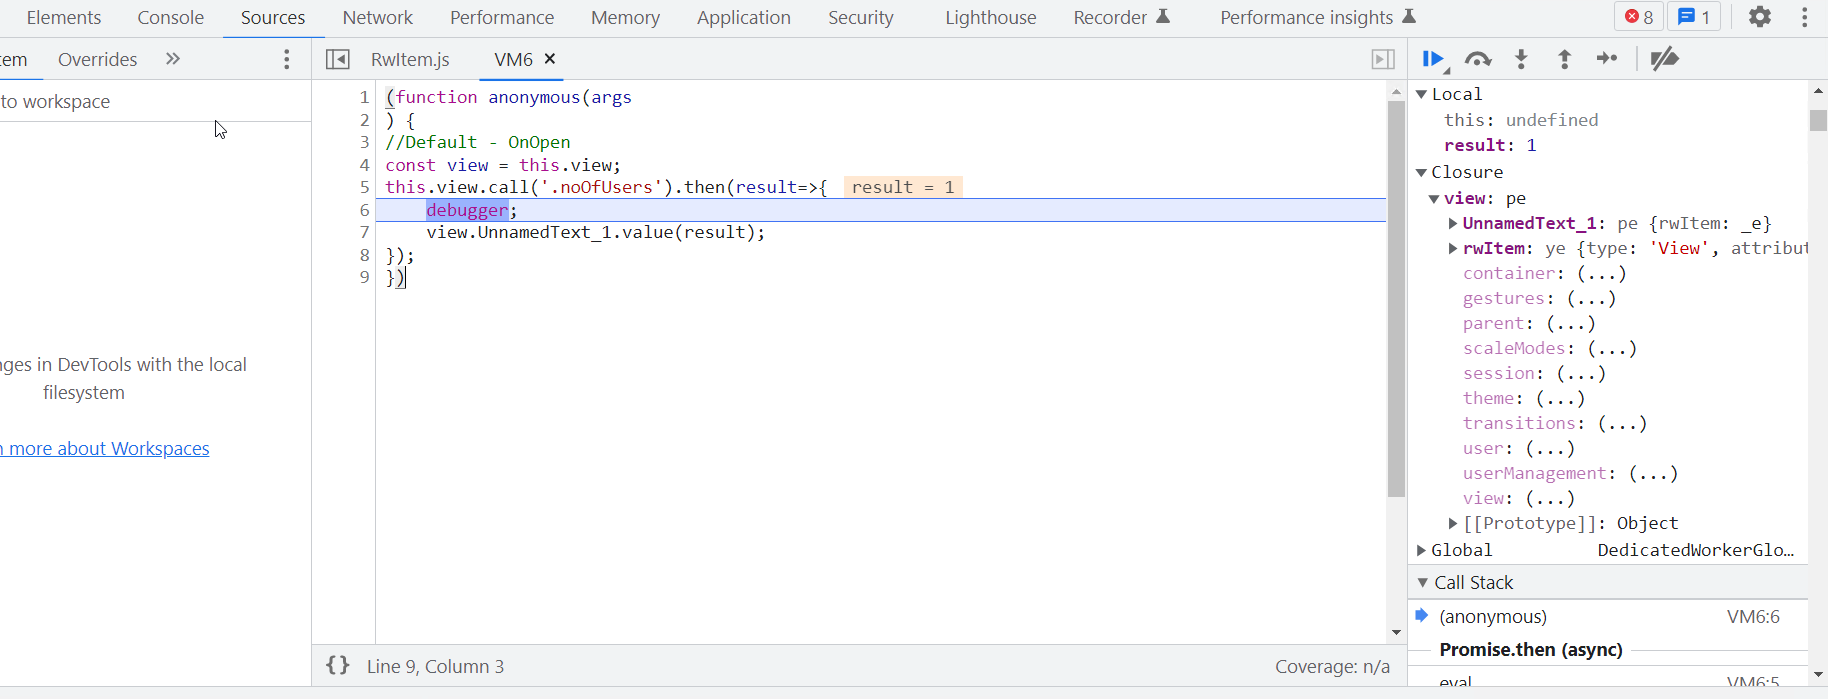
All code in OnOpen, OnManeuver, OnChange and OnClose executes in the browser, which means that the built in browser debugger is fully cabaple of tracking and debugging these attribute code snippets. To enable a debugging session, simply press ++F12++ or in menu Open Dev Tools....
In the script code being debugged, add the debugger keyword, save the file, and reload the browser. Trig the script code (if in OnOpen the code is triggered on page load). The browser will hang exactly on the debugger keyword. Press Play button to continue execution or Step into or Step over to execute statements one by one.
ServerSideFuncitons debugging
Simple approach
To be able to inspect the logical flow of your server, simply use the standard output from the SSF service.
Add console.log("My log information") to your SSF. Save the view file.
Open the arrigo-services-ssf log window by following these instructions .
Refresh the browser window and the log output from the SSF should be visible in the console window. Any errors present will appear in red.
Advanced approach
This approach is a bit tedious to set up, and the debug settings are lost when Attach project is run again. If custom services is used, the Service definition snippet in the project can be decorated instead of modifying the ecosystem.config.js file.
- Find the
ecosystem.config.jsfile inProgramData/Arrigo/Arrigo Local/pm2folder. - Open an editor with administrator privileges.
- Open the
ecosystem.config.jsfile in the editor (otherwise it can not be saved.). - Find the following section and add the
node_args: '--inspect',line at line6:ServerSideFunctions - Save the file.
- Open (as administrator) a console window
cmd.exeand entercd %ProgramData%/Arrigo/Arrigo Local/pm2. - Run the command
pm2 start ecosystem.config.jsto refresh the service configuration forarrigo-services-ssf. - Ensure all services starts and are online by running the command
pm2 listand verify allonline. - Open a Chrome web browser and enter
chrome://inspectin the address field. - Wait a couple of seconds until an entry appears on screen:
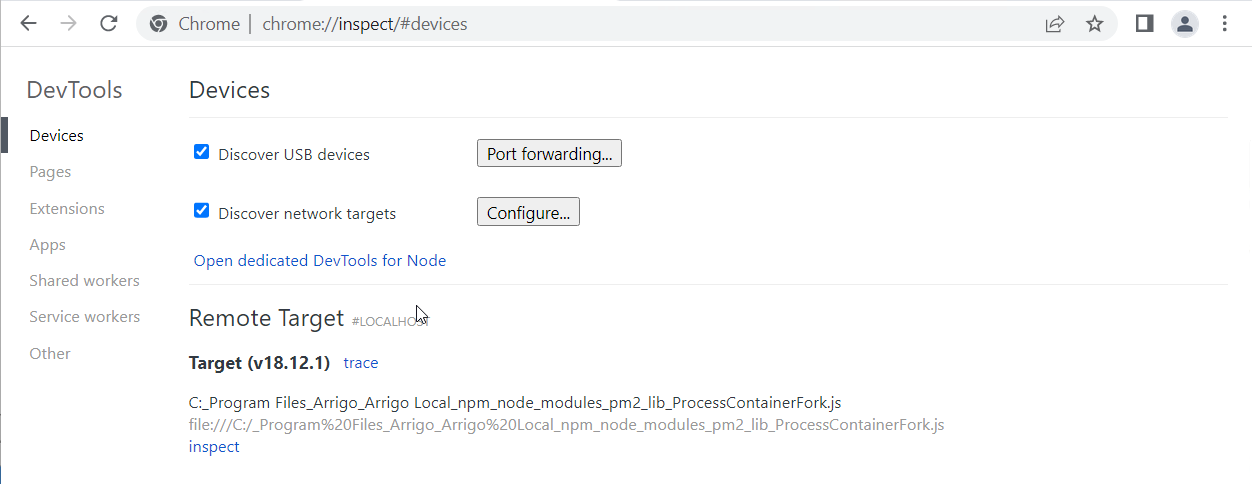
- Click on the
inspectlink, and see the standard output (same as in View logs above). - Select the Sources Tab and press reload. Any
debuggerstatements in theSSFfunction will halt the execution of all runningSSF:s (be careful on production environments).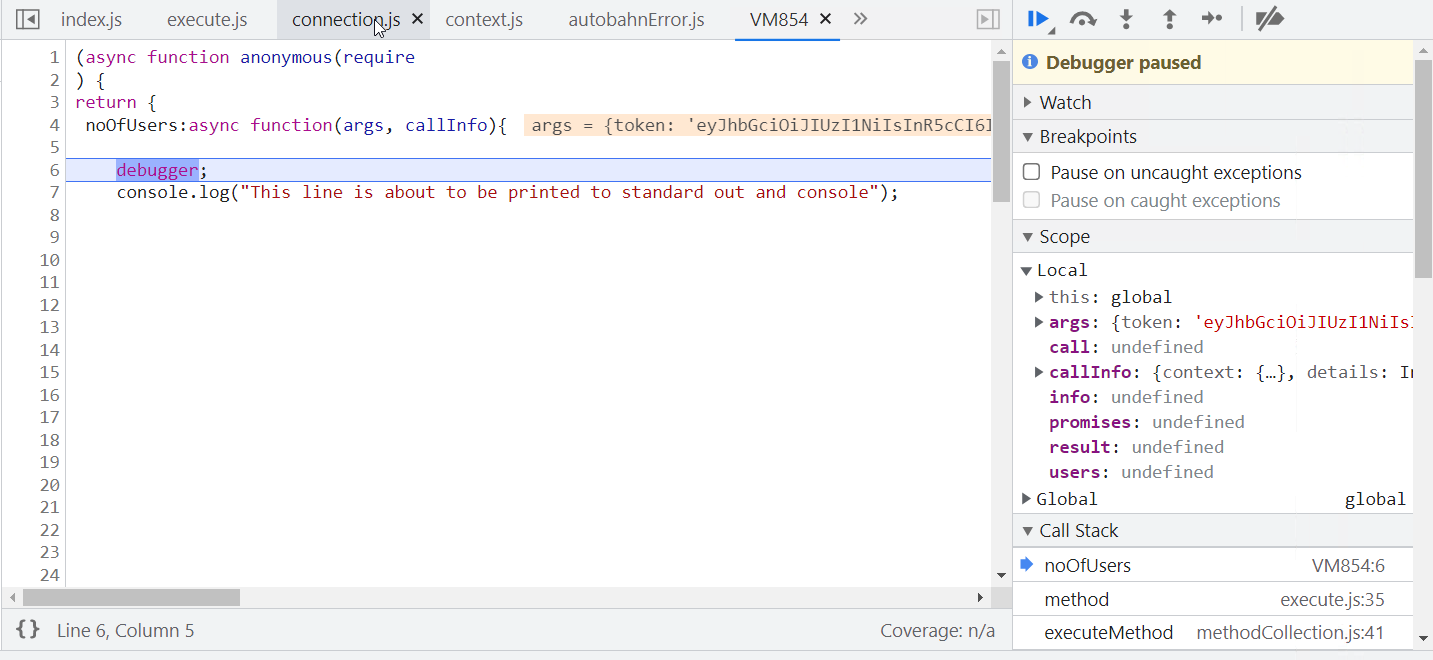
- Inspect and debug just as in frontend scenarios.
- To close the debugging session, just close the debugger window.
- To reset the
ecosystem.config.jsfile, remove the line or simply Attach project again.
Note
This approach is only available on localhost. To be able to remote debug a remote server, please read the topics on remote debugging NodeJS applications.